Welsh vs Danish Associate's Degree
COMPARE
Welsh
Danish
Associate's Degree
Associate's Degree Comparison
Welsh
Danes
45.9%
ASSOCIATE'S DEGREE
37.9/ 100
METRIC RATING
186th/ 347
METRIC RANK
47.4%
ASSOCIATE'S DEGREE
77.3/ 100
METRIC RATING
147th/ 347
METRIC RANK
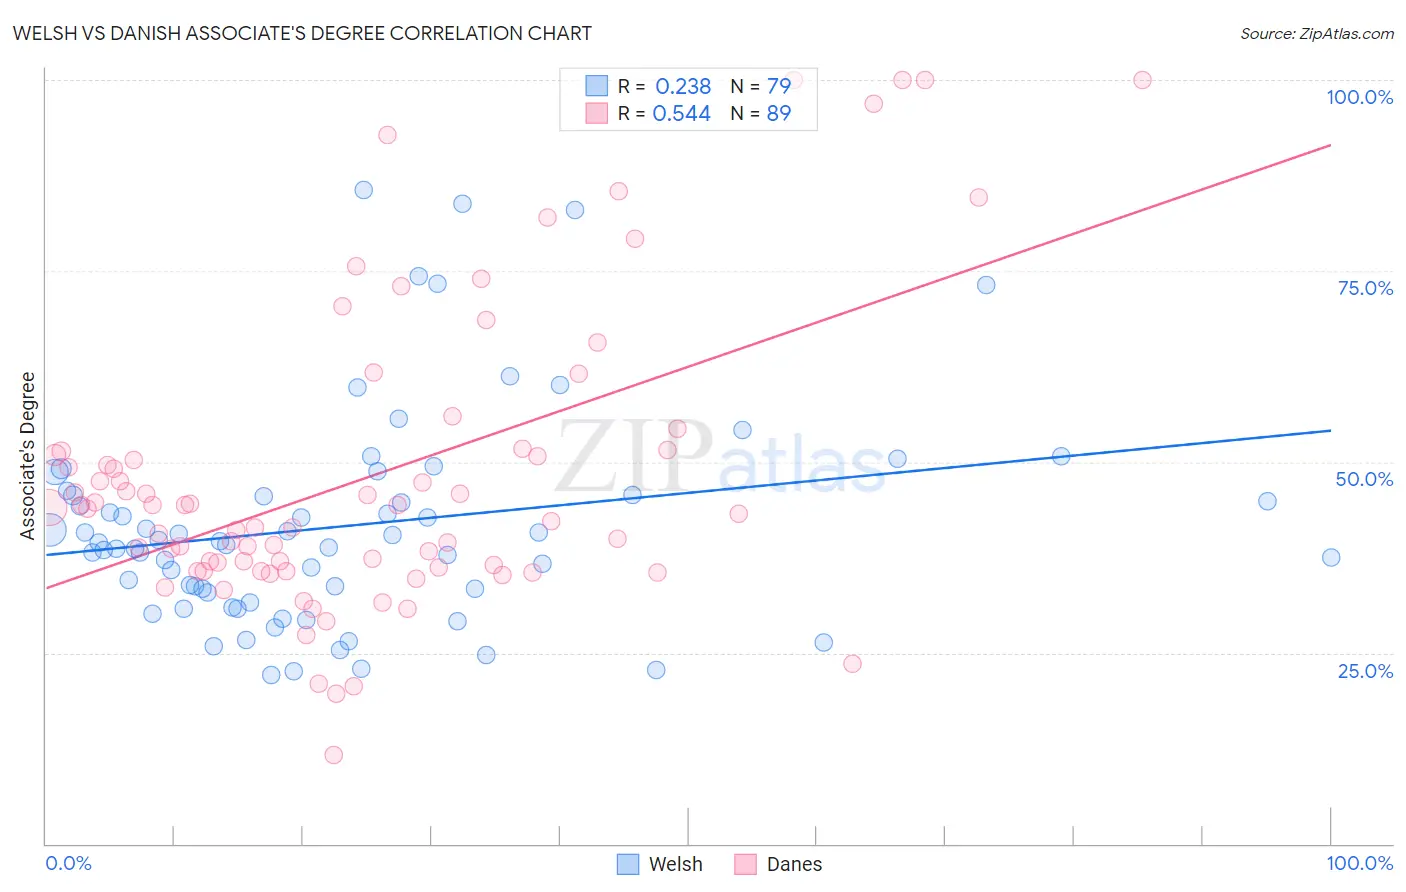
Welsh vs Danish Associate's Degree Correlation Chart
The statistical analysis conducted on geographies consisting of 528,554,894 people shows a weak positive correlation between the proportion of Welsh and percentage of population with at least associate's degree education in the United States with a correlation coefficient (R) of 0.238 and weighted average of 45.9%. Similarly, the statistical analysis conducted on geographies consisting of 474,170,437 people shows a substantial positive correlation between the proportion of Danes and percentage of population with at least associate's degree education in the United States with a correlation coefficient (R) of 0.544 and weighted average of 47.4%, a difference of 3.3%.
Associate's Degree Correlation Summary
| Measurement | Welsh | Danish |
| Minimum | 22.1% | 11.7% |
| Maximum | 85.6% | 100.0% |
| Range | 63.5% | 88.3% |
| Mean | 41.7% | 48.1% |
| Median | 39.4% | 43.9% |
| Interquartile 25% (IQ1) | 32.9% | 36.0% |
| Interquartile 75% (IQ3) | 45.7% | 51.5% |
| Interquartile Range (IQR) | 12.8% | 15.5% |
| Standard Deviation (Sample) | 14.0% | 19.6% |
| Standard Deviation (Population) | 13.9% | 19.5% |
Similar Demographics by Associate's Degree
Demographics Similar to Welsh by Associate's Degree
In terms of associate's degree, the demographic groups most similar to Welsh are Costa Rican (46.0%, a difference of 0.060%), Czechoslovakian (46.0%, a difference of 0.17%), Yugoslavian (46.0%, a difference of 0.19%), Swiss (46.0%, a difference of 0.20%), and Immigrants from Uruguay (45.8%, a difference of 0.20%).
| Demographics | Rating | Rank | Associate's Degree |
| Sri Lankans | 47.6 /100 | #179 | Average 46.3% |
| Bermudans | 46.4 /100 | #180 | Average 46.2% |
| Immigrants | Colombia | 41.3 /100 | #181 | Average 46.0% |
| Swiss | 40.4 /100 | #182 | Average 46.0% |
| Yugoslavians | 40.2 /100 | #183 | Average 46.0% |
| Czechoslovakians | 40.0 /100 | #184 | Average 46.0% |
| Costa Ricans | 38.6 /100 | #185 | Fair 46.0% |
| Welsh | 37.9 /100 | #186 | Fair 45.9% |
| Immigrants | Uruguay | 35.5 /100 | #187 | Fair 45.8% |
| Ghanaians | 35.5 /100 | #188 | Fair 45.8% |
| Immigrants | Oceania | 34.7 /100 | #189 | Fair 45.8% |
| Vietnamese | 34.0 /100 | #190 | Fair 45.8% |
| Koreans | 33.8 /100 | #191 | Fair 45.8% |
| Celtics | 33.3 /100 | #192 | Fair 45.8% |
| Immigrants | Cameroon | 31.0 /100 | #193 | Fair 45.7% |
Demographics Similar to Danes by Associate's Degree
In terms of associate's degree, the demographic groups most similar to Danes are Immigrants from Sudan (47.4%, a difference of 0.050%), South American Indian (47.4%, a difference of 0.060%), Immigrants from Armenia (47.4%, a difference of 0.070%), Iraqi (47.4%, a difference of 0.11%), and Immigrants from North Macedonia (47.4%, a difference of 0.14%).
| Demographics | Rating | Rank | Associate's Degree |
| Immigrants | Southern Europe | 84.4 /100 | #140 | Excellent 47.8% |
| Taiwanese | 83.3 /100 | #141 | Excellent 47.7% |
| Sierra Leoneans | 82.9 /100 | #142 | Excellent 47.7% |
| Norwegians | 81.0 /100 | #143 | Excellent 47.6% |
| Slavs | 80.5 /100 | #144 | Excellent 47.6% |
| Canadians | 79.0 /100 | #145 | Good 47.5% |
| Immigrants | Sudan | 77.9 /100 | #146 | Good 47.4% |
| Danes | 77.3 /100 | #147 | Good 47.4% |
| South American Indians | 76.7 /100 | #148 | Good 47.4% |
| Immigrants | Armenia | 76.6 /100 | #149 | Good 47.4% |
| Iraqis | 76.2 /100 | #150 | Good 47.4% |
| Immigrants | North Macedonia | 76.0 /100 | #151 | Good 47.4% |
| Immigrants | Afghanistan | 74.3 /100 | #152 | Good 47.3% |
| Czechs | 72.2 /100 | #153 | Good 47.2% |
| Immigrants | Kenya | 72.1 /100 | #154 | Good 47.2% |