Mexican American Indian vs Comanche Associate's Degree
COMPARE
Mexican American Indian
Comanche
Associate's Degree
Associate's Degree Comparison
Mexican American Indians
Comanche
38.2%
ASSOCIATE'S DEGREE
0.0/ 100
METRIC RATING
308th/ 347
METRIC RANK
39.9%
ASSOCIATE'S DEGREE
0.1/ 100
METRIC RATING
284th/ 347
METRIC RANK
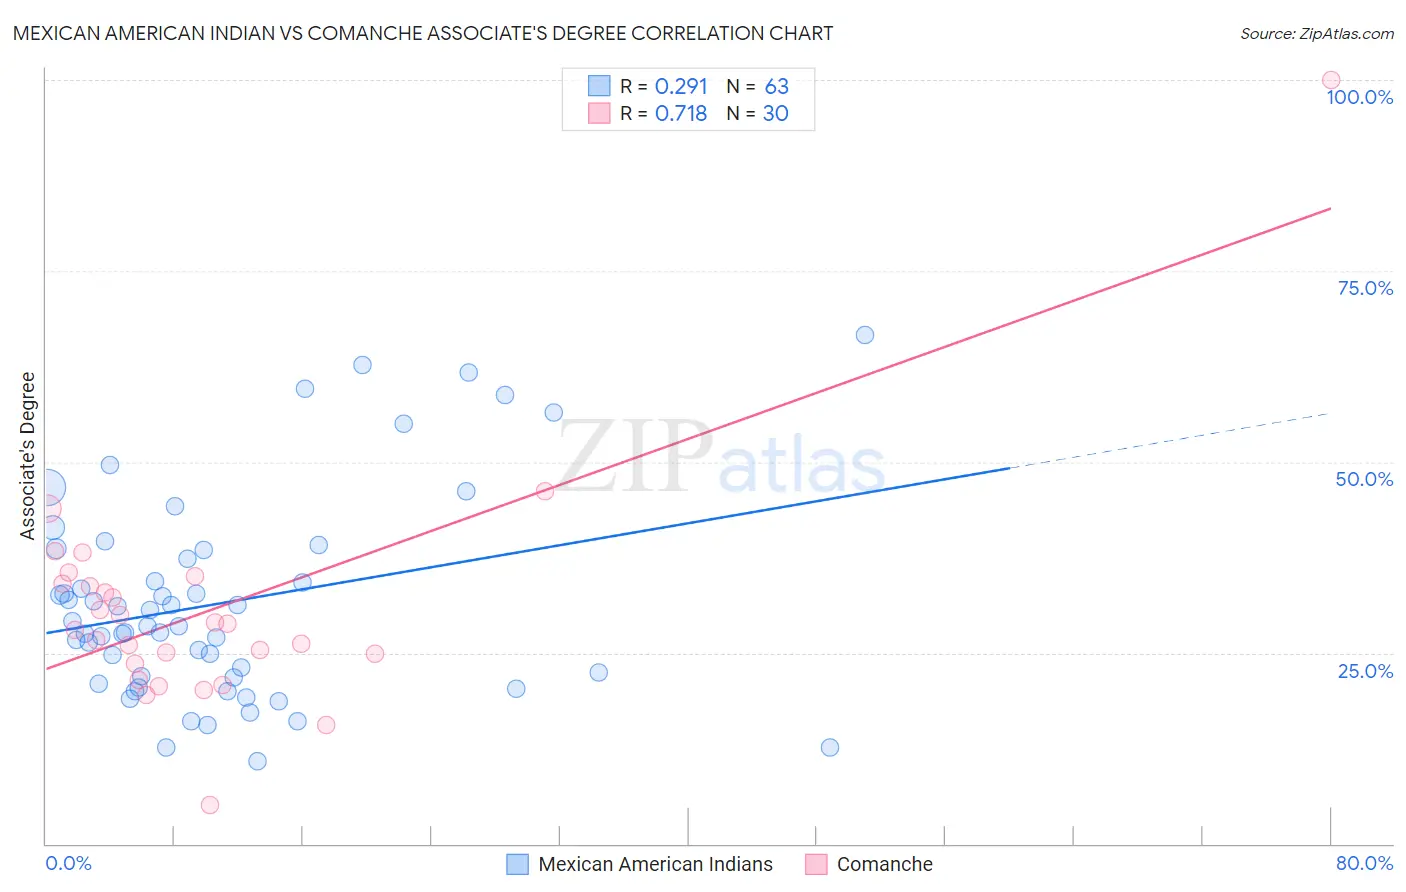
Mexican American Indian vs Comanche Associate's Degree Correlation Chart
The statistical analysis conducted on geographies consisting of 317,617,072 people shows a weak positive correlation between the proportion of Mexican American Indians and percentage of population with at least associate's degree education in the United States with a correlation coefficient (R) of 0.291 and weighted average of 38.2%. Similarly, the statistical analysis conducted on geographies consisting of 109,785,632 people shows a strong positive correlation between the proportion of Comanche and percentage of population with at least associate's degree education in the United States with a correlation coefficient (R) of 0.718 and weighted average of 39.9%, a difference of 4.6%.
Associate's Degree Correlation Summary
| Measurement | Mexican American Indian | Comanche |
| Minimum | 10.9% | 5.1% |
| Maximum | 66.7% | 100.0% |
| Range | 55.8% | 94.9% |
| Mean | 31.6% | 30.6% |
| Median | 28.6% | 28.4% |
| Interquartile 25% (IQ1) | 21.8% | 23.5% |
| Interquartile 75% (IQ3) | 38.5% | 34.0% |
| Interquartile Range (IQR) | 16.7% | 10.5% |
| Standard Deviation (Sample) | 13.3% | 15.6% |
| Standard Deviation (Population) | 13.2% | 15.3% |
Similar Demographics by Associate's Degree
Demographics Similar to Mexican American Indians by Associate's Degree
In terms of associate's degree, the demographic groups most similar to Mexican American Indians are Immigrants from Guatemala (38.1%, a difference of 0.040%), Immigrants from Dominican Republic (37.9%, a difference of 0.66%), Immigrants from El Salvador (38.4%, a difference of 0.67%), Shoshone (38.4%, a difference of 0.71%), and Immigrants from Latin America (37.9%, a difference of 0.77%).
| Demographics | Rating | Rank | Associate's Degree |
| Tsimshian | 0.0 /100 | #301 | Tragic 38.6% |
| Colville | 0.0 /100 | #302 | Tragic 38.5% |
| Guatemalans | 0.0 /100 | #303 | Tragic 38.5% |
| Sioux | 0.0 /100 | #304 | Tragic 38.5% |
| Immigrants | Honduras | 0.0 /100 | #305 | Tragic 38.5% |
| Shoshone | 0.0 /100 | #306 | Tragic 38.4% |
| Immigrants | El Salvador | 0.0 /100 | #307 | Tragic 38.4% |
| Mexican American Indians | 0.0 /100 | #308 | Tragic 38.2% |
| Immigrants | Guatemala | 0.0 /100 | #309 | Tragic 38.1% |
| Immigrants | Dominican Republic | 0.0 /100 | #310 | Tragic 37.9% |
| Immigrants | Latin America | 0.0 /100 | #311 | Tragic 37.9% |
| Choctaw | 0.0 /100 | #312 | Tragic 37.8% |
| Hispanics or Latinos | 0.0 /100 | #313 | Tragic 37.7% |
| Seminole | 0.0 /100 | #314 | Tragic 37.7% |
| Creek | 0.0 /100 | #315 | Tragic 37.6% |
Demographics Similar to Comanche by Associate's Degree
In terms of associate's degree, the demographic groups most similar to Comanche are Immigrants from Belize (39.9%, a difference of 0.10%), Haitian (40.0%, a difference of 0.12%), Bangladeshi (40.0%, a difference of 0.26%), Immigrants from Caribbean (39.7%, a difference of 0.44%), and Immigrants from Portugal (40.1%, a difference of 0.58%).
| Demographics | Rating | Rank | Associate's Degree |
| Blackfeet | 0.1 /100 | #277 | Tragic 40.3% |
| Ottawa | 0.1 /100 | #278 | Tragic 40.3% |
| Immigrants | Nicaragua | 0.1 /100 | #279 | Tragic 40.3% |
| Immigrants | Micronesia | 0.1 /100 | #280 | Tragic 40.2% |
| Immigrants | Portugal | 0.1 /100 | #281 | Tragic 40.1% |
| Bangladeshis | 0.1 /100 | #282 | Tragic 40.0% |
| Haitians | 0.1 /100 | #283 | Tragic 40.0% |
| Comanche | 0.1 /100 | #284 | Tragic 39.9% |
| Immigrants | Belize | 0.1 /100 | #285 | Tragic 39.9% |
| Immigrants | Caribbean | 0.0 /100 | #286 | Tragic 39.7% |
| Aleuts | 0.0 /100 | #287 | Tragic 39.6% |
| Immigrants | Cuba | 0.0 /100 | #288 | Tragic 39.5% |
| Central Americans | 0.0 /100 | #289 | Tragic 39.4% |
| Immigrants | Haiti | 0.0 /100 | #290 | Tragic 39.3% |
| Dominicans | 0.0 /100 | #291 | Tragic 39.3% |