Ute vs Immigrants from Laos 7th Grade
COMPARE
Ute
Immigrants from Laos
7th Grade
7th Grade Comparison
Ute
Immigrants from Laos
96.1%
7TH GRADE
55.8/ 100
METRIC RATING
169th/ 347
METRIC RANK
94.5%
7TH GRADE
0.0/ 100
METRIC RATING
302nd/ 347
METRIC RANK
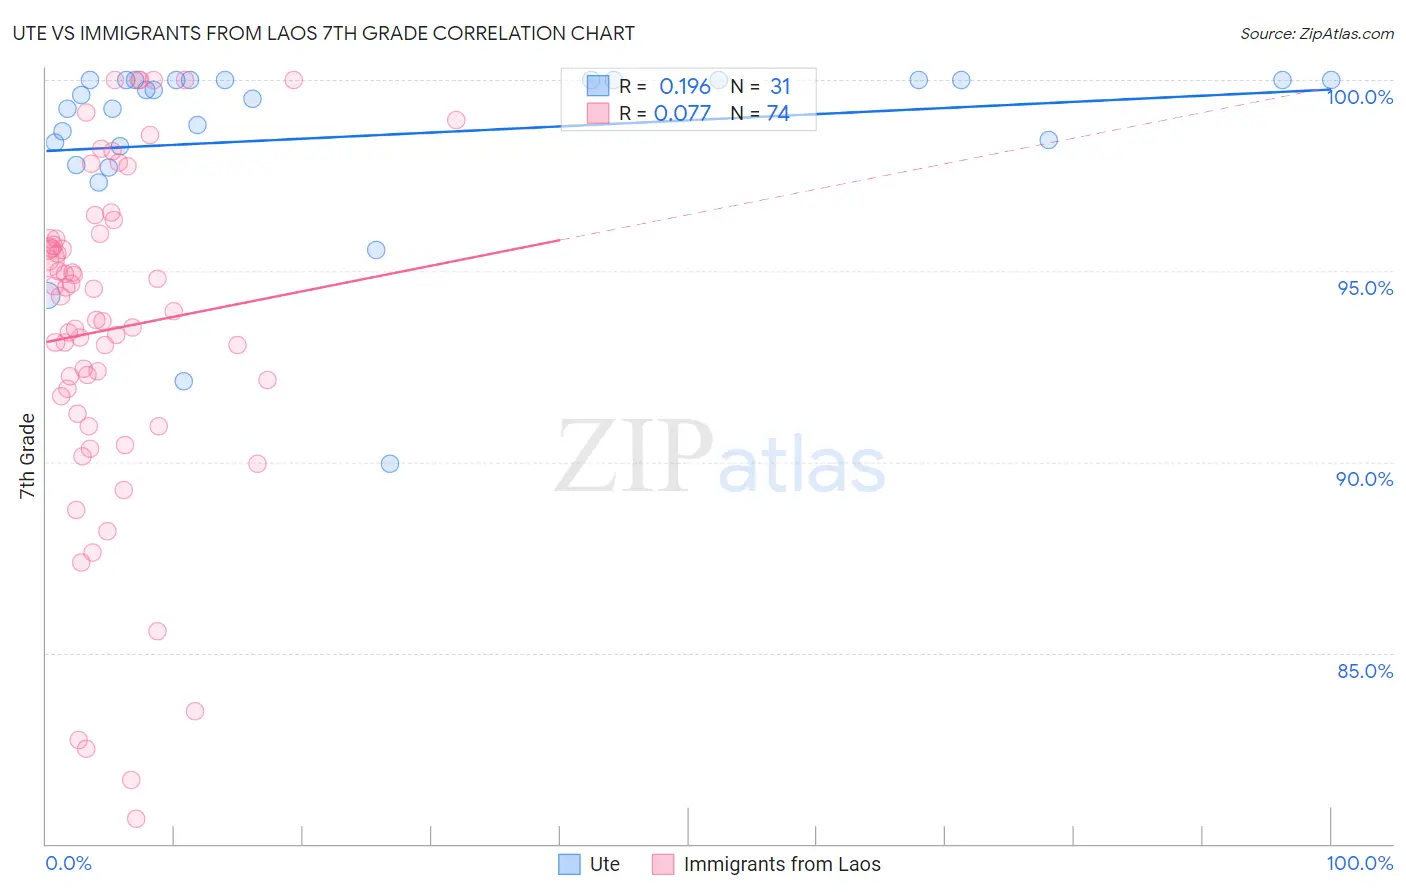
Ute vs Immigrants from Laos 7th Grade Correlation Chart
The statistical analysis conducted on geographies consisting of 55,668,539 people shows a poor positive correlation between the proportion of Ute and percentage of population with at least 7th grade education in the United States with a correlation coefficient (R) of 0.196 and weighted average of 96.1%. Similarly, the statistical analysis conducted on geographies consisting of 201,472,886 people shows a slight positive correlation between the proportion of Immigrants from Laos and percentage of population with at least 7th grade education in the United States with a correlation coefficient (R) of 0.077 and weighted average of 94.5%, a difference of 1.7%.
7th Grade Correlation Summary
| Measurement | Ute | Immigrants from Laos |
| Minimum | 89.9% | 80.6% |
| Maximum | 100.0% | 100.0% |
| Range | 10.1% | 19.4% |
| Mean | 98.5% | 93.5% |
| Median | 99.6% | 94.1% |
| Interquartile 25% (IQ1) | 98.3% | 91.7% |
| Interquartile 75% (IQ3) | 100.0% | 95.8% |
| Interquartile Range (IQR) | 1.7% | 4.1% |
| Standard Deviation (Sample) | 2.4% | 4.5% |
| Standard Deviation (Population) | 2.4% | 4.4% |
Similar Demographics by 7th Grade
Demographics Similar to Ute by 7th Grade
In terms of 7th grade, the demographic groups most similar to Ute are Immigrants from Ukraine (96.1%, a difference of 0.0%), Egyptian (96.1%, a difference of 0.010%), Immigrants from Poland (96.1%, a difference of 0.020%), Immigrants from Kazakhstan (96.1%, a difference of 0.030%), and Immigrants from Sri Lanka (96.1%, a difference of 0.030%).
| Demographics | Rating | Rank | 7th Grade |
| Pima | 64.3 /100 | #162 | Good 96.1% |
| Spaniards | 62.6 /100 | #163 | Good 96.1% |
| Immigrants | Italy | 62.1 /100 | #164 | Good 96.1% |
| Immigrants | Taiwan | 61.5 /100 | #165 | Good 96.1% |
| Immigrants | Kazakhstan | 61.0 /100 | #166 | Good 96.1% |
| Immigrants | Sri Lanka | 59.9 /100 | #167 | Average 96.1% |
| Immigrants | Poland | 59.0 /100 | #168 | Average 96.1% |
| Ute | 55.8 /100 | #169 | Average 96.1% |
| Immigrants | Ukraine | 55.0 /100 | #170 | Average 96.1% |
| Egyptians | 54.2 /100 | #171 | Average 96.1% |
| Venezuelans | 51.4 /100 | #172 | Average 96.0% |
| Immigrants | Albania | 50.4 /100 | #173 | Average 96.0% |
| Mongolians | 50.0 /100 | #174 | Average 96.0% |
| Blacks/African Americans | 49.5 /100 | #175 | Average 96.0% |
| Chileans | 49.3 /100 | #176 | Average 96.0% |
Demographics Similar to Immigrants from Laos by 7th Grade
In terms of 7th grade, the demographic groups most similar to Immigrants from Laos are Immigrants from Dominica (94.5%, a difference of 0.0%), Immigrants from Burma/Myanmar (94.5%, a difference of 0.030%), Indonesian (94.5%, a difference of 0.070%), Bangladeshi (94.5%, a difference of 0.070%), and Immigrants from South Eastern Asia (94.5%, a difference of 0.080%).
| Demographics | Rating | Rank | 7th Grade |
| Yaqui | 0.0 /100 | #295 | Tragic 94.6% |
| Cubans | 0.0 /100 | #296 | Tragic 94.6% |
| Immigrants | South Eastern Asia | 0.0 /100 | #297 | Tragic 94.5% |
| Indonesians | 0.0 /100 | #298 | Tragic 94.5% |
| Bangladeshis | 0.0 /100 | #299 | Tragic 94.5% |
| Immigrants | Burma/Myanmar | 0.0 /100 | #300 | Tragic 94.5% |
| Immigrants | Dominica | 0.0 /100 | #301 | Tragic 94.5% |
| Immigrants | Laos | 0.0 /100 | #302 | Tragic 94.5% |
| Sri Lankans | 0.0 /100 | #303 | Tragic 94.4% |
| Immigrants | Haiti | 0.0 /100 | #304 | Tragic 94.3% |
| Guyanese | 0.0 /100 | #305 | Tragic 94.3% |
| Immigrants | Guyana | 0.0 /100 | #306 | Tragic 94.2% |
| Immigrants | Portugal | 0.0 /100 | #307 | Tragic 94.2% |
| Cape Verdeans | 0.0 /100 | #308 | Tragic 94.1% |
| Ecuadorians | 0.0 /100 | #309 | Tragic 94.0% |