French vs Immigrants from Laos College, Under 1 year
COMPARE
French
Immigrants from Laos
College, Under 1 year
College, Under 1 year Comparison
French
Immigrants from Laos
65.4%
COLLEGE, UNDER 1 YEAR
48.9/ 100
METRIC RATING
176th/ 347
METRIC RANK
61.3%
COLLEGE, UNDER 1 YEAR
0.3/ 100
METRIC RATING
257th/ 347
METRIC RANK
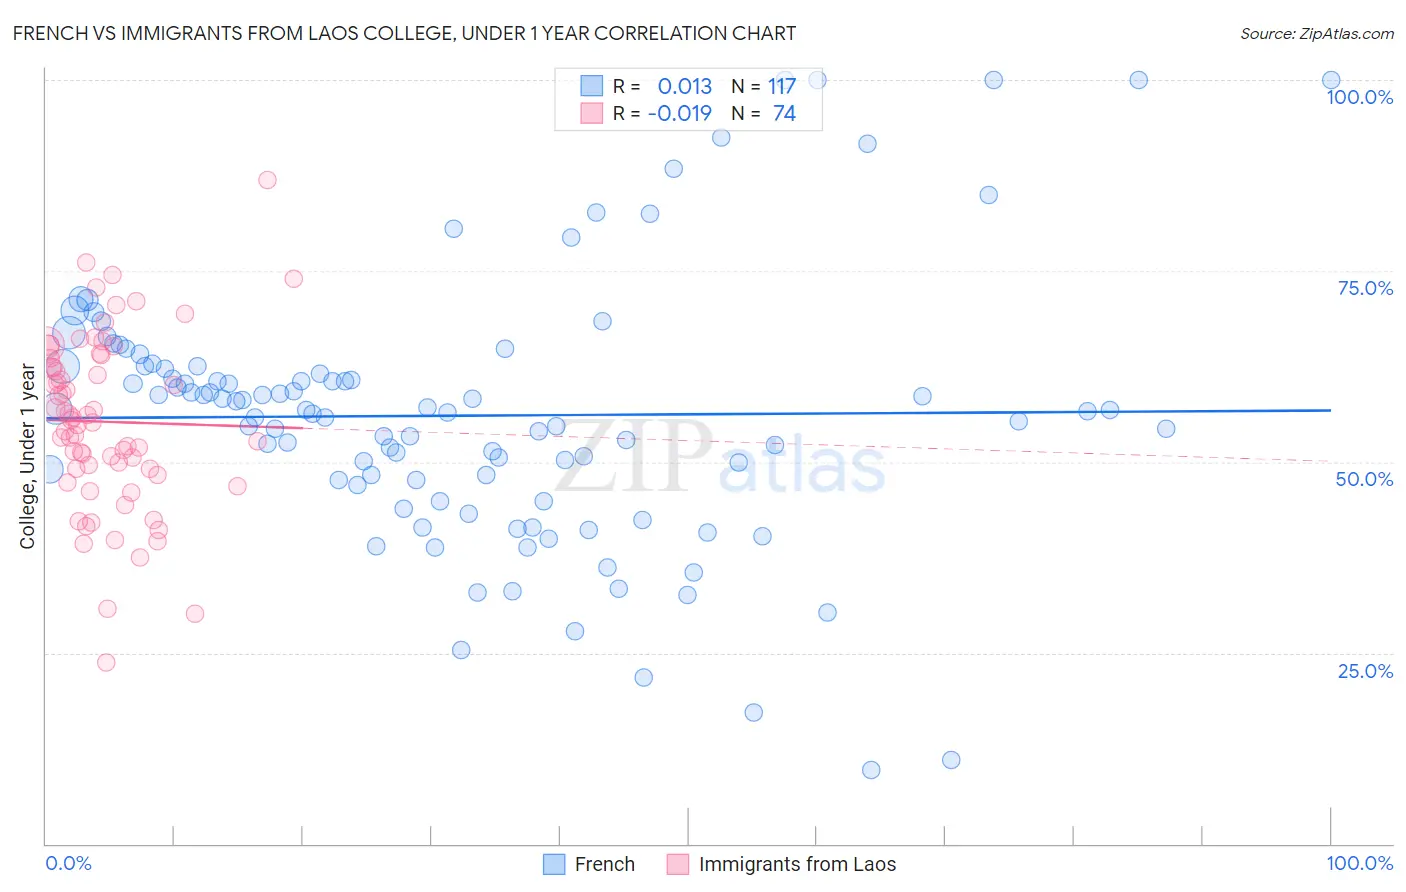
French vs Immigrants from Laos College, Under 1 year Correlation Chart
The statistical analysis conducted on geographies consisting of 572,421,554 people shows no correlation between the proportion of French and percentage of population with at least college, under 1 year education in the United States with a correlation coefficient (R) of 0.013 and weighted average of 65.4%. Similarly, the statistical analysis conducted on geographies consisting of 201,475,732 people shows no correlation between the proportion of Immigrants from Laos and percentage of population with at least college, under 1 year education in the United States with a correlation coefficient (R) of -0.019 and weighted average of 61.3%, a difference of 6.7%.
College, Under 1 year Correlation Summary
| Measurement | French | Immigrants from Laos |
| Minimum | 9.7% | 23.8% |
| Maximum | 100.0% | 86.9% |
| Range | 90.3% | 63.2% |
| Mean | 56.0% | 55.2% |
| Median | 56.6% | 55.3% |
| Interquartile 25% (IQ1) | 47.3% | 49.0% |
| Interquartile 75% (IQ3) | 62.5% | 63.6% |
| Interquartile Range (IQR) | 15.2% | 14.5% |
| Standard Deviation (Sample) | 17.4% | 11.4% |
| Standard Deviation (Population) | 17.3% | 11.4% |
Similar Demographics by College, Under 1 year
Demographics Similar to French by College, Under 1 year
In terms of college, under 1 year, the demographic groups most similar to French are Immigrants from North Macedonia (65.4%, a difference of 0.010%), Scotch-Irish (65.4%, a difference of 0.030%), German Russian (65.4%, a difference of 0.030%), Guamanian/Chamorro (65.4%, a difference of 0.030%), and Immigrants from Bosnia and Herzegovina (65.4%, a difference of 0.050%).
| Demographics | Rating | Rank | College, Under 1 year |
| Yugoslavians | 55.7 /100 | #169 | Average 65.6% |
| Germans | 55.7 /100 | #170 | Average 65.6% |
| Immigrants | Oceania | 55.0 /100 | #171 | Average 65.6% |
| South American Indians | 54.4 /100 | #172 | Average 65.5% |
| Swiss | 53.9 /100 | #173 | Average 65.5% |
| Immigrants | Bosnia and Herzegovina | 50.0 /100 | #174 | Average 65.4% |
| Scotch-Irish | 49.5 /100 | #175 | Average 65.4% |
| French | 48.9 /100 | #176 | Average 65.4% |
| Immigrants | North Macedonia | 48.6 /100 | #177 | Average 65.4% |
| German Russians | 48.3 /100 | #178 | Average 65.4% |
| Guamanians/Chamorros | 48.2 /100 | #179 | Average 65.4% |
| Dutch | 46.1 /100 | #180 | Average 65.3% |
| Spaniards | 45.5 /100 | #181 | Average 65.3% |
| Immigrants | Africa | 44.7 /100 | #182 | Average 65.3% |
| Immigrants | Poland | 42.6 /100 | #183 | Average 65.2% |
Demographics Similar to Immigrants from Laos by College, Under 1 year
In terms of college, under 1 year, the demographic groups most similar to Immigrants from Laos are Immigrants from Bangladesh (61.3%, a difference of 0.060%), Indonesian (61.2%, a difference of 0.080%), Bangladeshi (61.4%, a difference of 0.11%), Comanche (61.4%, a difference of 0.16%), and Blackfeet (61.1%, a difference of 0.25%).
| Demographics | Rating | Rank | College, Under 1 year |
| Immigrants | Congo | 0.5 /100 | #250 | Tragic 61.7% |
| Immigrants | Micronesia | 0.5 /100 | #251 | Tragic 61.5% |
| West Indians | 0.4 /100 | #252 | Tragic 61.5% |
| Japanese | 0.4 /100 | #253 | Tragic 61.5% |
| Immigrants | Cambodia | 0.4 /100 | #254 | Tragic 61.5% |
| Comanche | 0.4 /100 | #255 | Tragic 61.4% |
| Bangladeshis | 0.4 /100 | #256 | Tragic 61.4% |
| Immigrants | Laos | 0.3 /100 | #257 | Tragic 61.3% |
| Immigrants | Bangladesh | 0.3 /100 | #258 | Tragic 61.3% |
| Indonesians | 0.3 /100 | #259 | Tragic 61.2% |
| Blackfeet | 0.3 /100 | #260 | Tragic 61.1% |
| Africans | 0.3 /100 | #261 | Tragic 61.1% |
| Barbadians | 0.2 /100 | #262 | Tragic 61.1% |
| Shoshone | 0.2 /100 | #263 | Tragic 61.1% |
| Trinidadians and Tobagonians | 0.2 /100 | #264 | Tragic 61.1% |