Immigrants from Trinidad and Tobago vs Immigrants from Laos College, Under 1 year
COMPARE
Immigrants from Trinidad and Tobago
Immigrants from Laos
College, Under 1 year
College, Under 1 year Comparison
Immigrants from Trinidad and Tobago
Immigrants from Laos
60.7%
COLLEGE, UNDER 1 YEAR
0.1/ 100
METRIC RATING
268th/ 347
METRIC RANK
61.3%
COLLEGE, UNDER 1 YEAR
0.3/ 100
METRIC RATING
257th/ 347
METRIC RANK
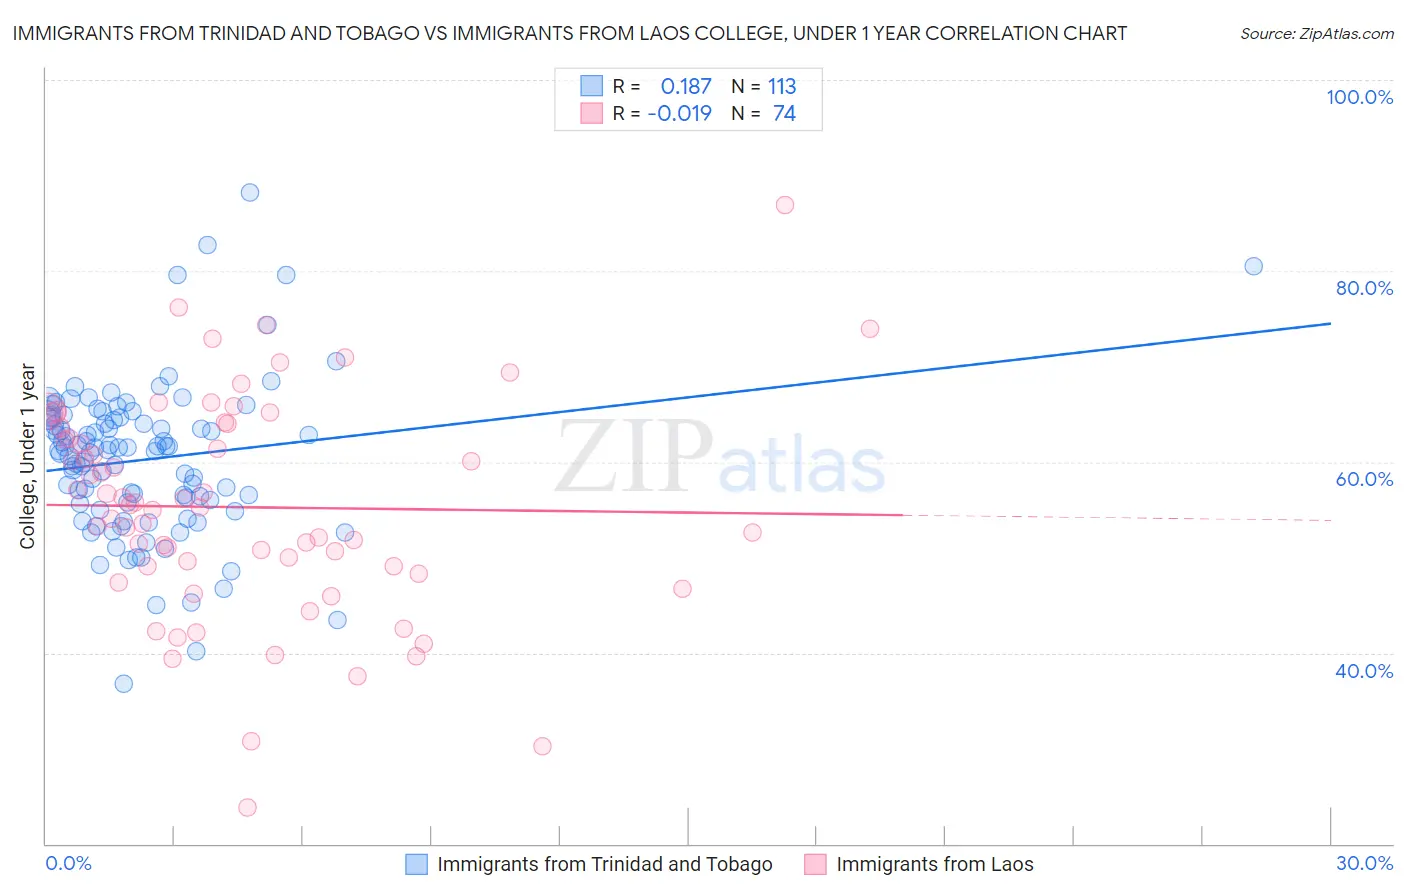
Immigrants from Trinidad and Tobago vs Immigrants from Laos College, Under 1 year Correlation Chart
The statistical analysis conducted on geographies consisting of 223,526,872 people shows a poor positive correlation between the proportion of Immigrants from Trinidad and Tobago and percentage of population with at least college, under 1 year education in the United States with a correlation coefficient (R) of 0.187 and weighted average of 60.7%. Similarly, the statistical analysis conducted on geographies consisting of 201,475,732 people shows no correlation between the proportion of Immigrants from Laos and percentage of population with at least college, under 1 year education in the United States with a correlation coefficient (R) of -0.019 and weighted average of 61.3%, a difference of 0.97%.
College, Under 1 year Correlation Summary
| Measurement | Immigrants from Trinidad and Tobago | Immigrants from Laos |
| Minimum | 36.7% | 23.8% |
| Maximum | 88.2% | 86.9% |
| Range | 51.4% | 63.2% |
| Mean | 60.3% | 55.2% |
| Median | 61.2% | 55.3% |
| Interquartile 25% (IQ1) | 55.6% | 49.0% |
| Interquartile 75% (IQ3) | 64.6% | 63.6% |
| Interquartile Range (IQR) | 9.0% | 14.5% |
| Standard Deviation (Sample) | 8.0% | 11.4% |
| Standard Deviation (Population) | 8.0% | 11.4% |
Demographics Similar to Immigrants from Trinidad and Tobago and Immigrants from Laos by College, Under 1 year
In terms of college, under 1 year, the demographic groups most similar to Immigrants from Trinidad and Tobago are Immigrants from West Indies (60.6%, a difference of 0.12%), Cheyenne (60.6%, a difference of 0.23%), U.S. Virgin Islander (60.6%, a difference of 0.24%), Jamaican (60.5%, a difference of 0.40%), and American (61.0%, a difference of 0.45%). Similarly, the demographic groups most similar to Immigrants from Laos are Immigrants from Bangladesh (61.3%, a difference of 0.060%), Indonesian (61.2%, a difference of 0.080%), Bangladeshi (61.4%, a difference of 0.11%), Comanche (61.4%, a difference of 0.16%), and Blackfeet (61.1%, a difference of 0.25%).
| Demographics | Rating | Rank | College, Under 1 year |
| West Indians | 0.4 /100 | #252 | Tragic 61.5% |
| Japanese | 0.4 /100 | #253 | Tragic 61.5% |
| Immigrants | Cambodia | 0.4 /100 | #254 | Tragic 61.5% |
| Comanche | 0.4 /100 | #255 | Tragic 61.4% |
| Bangladeshis | 0.4 /100 | #256 | Tragic 61.4% |
| Immigrants | Laos | 0.3 /100 | #257 | Tragic 61.3% |
| Immigrants | Bangladesh | 0.3 /100 | #258 | Tragic 61.3% |
| Indonesians | 0.3 /100 | #259 | Tragic 61.2% |
| Blackfeet | 0.3 /100 | #260 | Tragic 61.1% |
| Africans | 0.3 /100 | #261 | Tragic 61.1% |
| Barbadians | 0.2 /100 | #262 | Tragic 61.1% |
| Shoshone | 0.2 /100 | #263 | Tragic 61.1% |
| Trinidadians and Tobagonians | 0.2 /100 | #264 | Tragic 61.1% |
| Immigrants | Bahamas | 0.2 /100 | #265 | Tragic 61.1% |
| Alaskan Athabascans | 0.2 /100 | #266 | Tragic 61.0% |
| Americans | 0.2 /100 | #267 | Tragic 61.0% |
| Immigrants | Trinidad and Tobago | 0.1 /100 | #268 | Tragic 60.7% |
| Immigrants | West Indies | 0.1 /100 | #269 | Tragic 60.6% |
| Cheyenne | 0.1 /100 | #270 | Tragic 60.6% |
| U.S. Virgin Islanders | 0.1 /100 | #271 | Tragic 60.6% |
| Jamaicans | 0.1 /100 | #272 | Tragic 60.5% |