Russian vs Immigrants from Laos College, Under 1 year
COMPARE
Russian
Immigrants from Laos
College, Under 1 year
College, Under 1 year Comparison
Russians
Immigrants from Laos
70.5%
COLLEGE, UNDER 1 YEAR
99.9/ 100
METRIC RATING
35th/ 347
METRIC RANK
61.3%
COLLEGE, UNDER 1 YEAR
0.3/ 100
METRIC RATING
257th/ 347
METRIC RANK
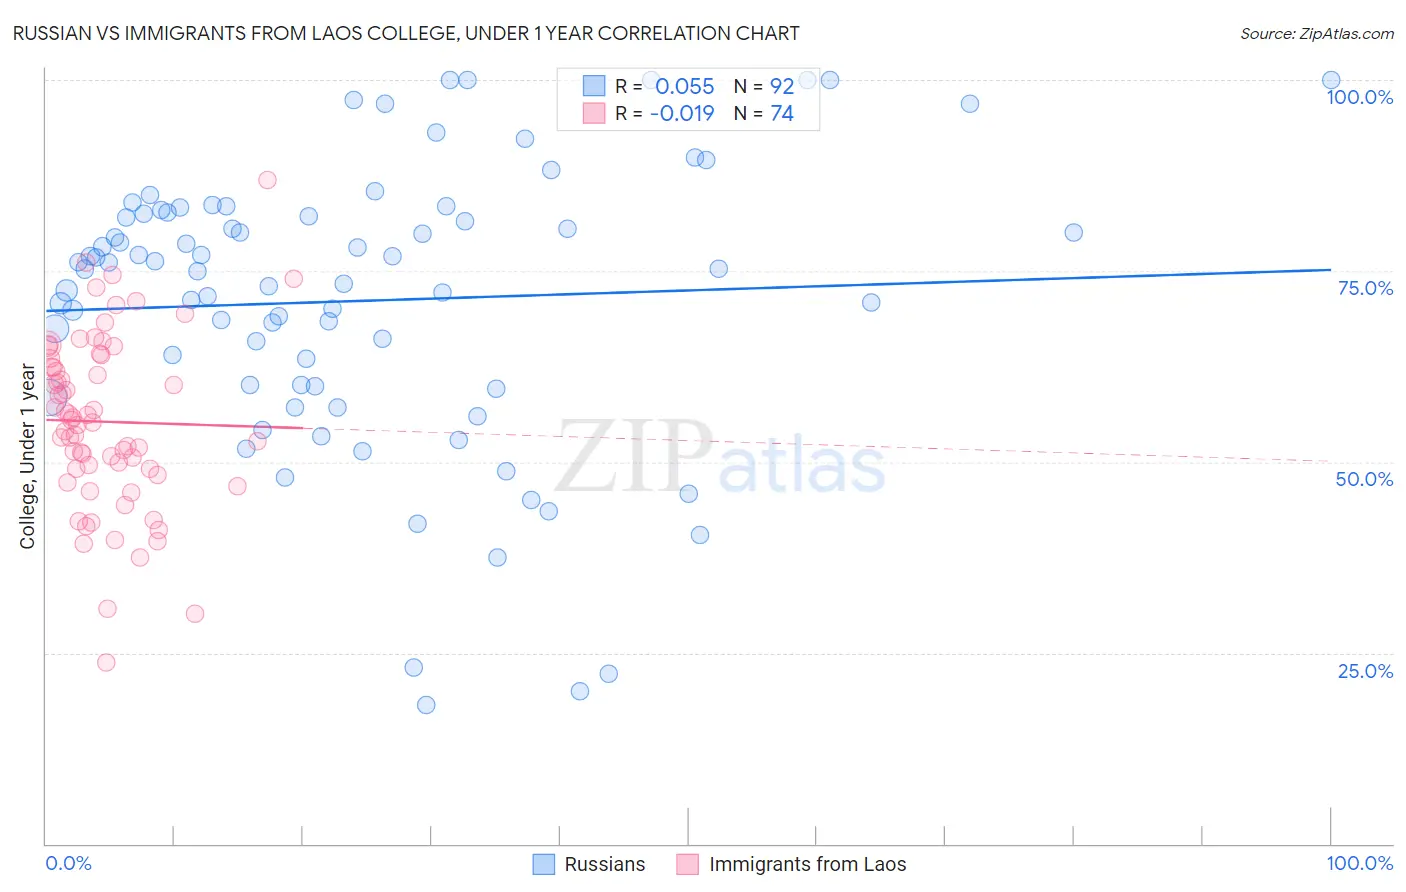
Russian vs Immigrants from Laos College, Under 1 year Correlation Chart
The statistical analysis conducted on geographies consisting of 512,255,371 people shows a slight positive correlation between the proportion of Russians and percentage of population with at least college, under 1 year education in the United States with a correlation coefficient (R) of 0.055 and weighted average of 70.5%. Similarly, the statistical analysis conducted on geographies consisting of 201,475,732 people shows no correlation between the proportion of Immigrants from Laos and percentage of population with at least college, under 1 year education in the United States with a correlation coefficient (R) of -0.019 and weighted average of 61.3%, a difference of 15.1%.
College, Under 1 year Correlation Summary
| Measurement | Russian | Immigrants from Laos |
| Minimum | 18.2% | 23.8% |
| Maximum | 100.0% | 86.9% |
| Range | 81.8% | 63.2% |
| Mean | 71.1% | 55.2% |
| Median | 75.2% | 55.3% |
| Interquartile 25% (IQ1) | 60.0% | 49.0% |
| Interquartile 75% (IQ3) | 82.5% | 63.6% |
| Interquartile Range (IQR) | 22.5% | 14.5% |
| Standard Deviation (Sample) | 18.5% | 11.4% |
| Standard Deviation (Population) | 18.4% | 11.4% |
Similar Demographics by College, Under 1 year
Demographics Similar to Russians by College, Under 1 year
In terms of college, under 1 year, the demographic groups most similar to Russians are Immigrants from Sri Lanka (70.5%, a difference of 0.060%), Estonian (70.6%, a difference of 0.080%), Immigrants from South Africa (70.6%, a difference of 0.10%), Immigrants from Saudi Arabia (70.4%, a difference of 0.17%), and Australian (70.4%, a difference of 0.25%).
| Demographics | Rating | Rank | College, Under 1 year |
| Immigrants | Hong Kong | 100.0 /100 | #28 | Exceptional 71.0% |
| Immigrants | France | 100.0 /100 | #29 | Exceptional 71.0% |
| Immigrants | China | 99.9 /100 | #30 | Exceptional 70.9% |
| Indians (Asian) | 99.9 /100 | #31 | Exceptional 70.8% |
| Turks | 99.9 /100 | #32 | Exceptional 70.7% |
| Immigrants | South Africa | 99.9 /100 | #33 | Exceptional 70.6% |
| Estonians | 99.9 /100 | #34 | Exceptional 70.6% |
| Russians | 99.9 /100 | #35 | Exceptional 70.5% |
| Immigrants | Sri Lanka | 99.9 /100 | #36 | Exceptional 70.5% |
| Immigrants | Saudi Arabia | 99.9 /100 | #37 | Exceptional 70.4% |
| Australians | 99.9 /100 | #38 | Exceptional 70.4% |
| Bhutanese | 99.9 /100 | #39 | Exceptional 70.3% |
| Immigrants | Turkey | 99.9 /100 | #40 | Exceptional 70.3% |
| Immigrants | Kuwait | 99.9 /100 | #41 | Exceptional 70.3% |
| Immigrants | Lithuania | 99.9 /100 | #42 | Exceptional 70.3% |
Demographics Similar to Immigrants from Laos by College, Under 1 year
In terms of college, under 1 year, the demographic groups most similar to Immigrants from Laos are Immigrants from Bangladesh (61.3%, a difference of 0.060%), Indonesian (61.2%, a difference of 0.080%), Bangladeshi (61.4%, a difference of 0.11%), Comanche (61.4%, a difference of 0.16%), and Blackfeet (61.1%, a difference of 0.25%).
| Demographics | Rating | Rank | College, Under 1 year |
| Immigrants | Congo | 0.5 /100 | #250 | Tragic 61.7% |
| Immigrants | Micronesia | 0.5 /100 | #251 | Tragic 61.5% |
| West Indians | 0.4 /100 | #252 | Tragic 61.5% |
| Japanese | 0.4 /100 | #253 | Tragic 61.5% |
| Immigrants | Cambodia | 0.4 /100 | #254 | Tragic 61.5% |
| Comanche | 0.4 /100 | #255 | Tragic 61.4% |
| Bangladeshis | 0.4 /100 | #256 | Tragic 61.4% |
| Immigrants | Laos | 0.3 /100 | #257 | Tragic 61.3% |
| Immigrants | Bangladesh | 0.3 /100 | #258 | Tragic 61.3% |
| Indonesians | 0.3 /100 | #259 | Tragic 61.2% |
| Blackfeet | 0.3 /100 | #260 | Tragic 61.1% |
| Africans | 0.3 /100 | #261 | Tragic 61.1% |
| Barbadians | 0.2 /100 | #262 | Tragic 61.1% |
| Shoshone | 0.2 /100 | #263 | Tragic 61.1% |
| Trinidadians and Tobagonians | 0.2 /100 | #264 | Tragic 61.1% |