Japanese vs Immigrants from Laos College, Under 1 year
COMPARE
Japanese
Immigrants from Laos
College, Under 1 year
College, Under 1 year Comparison
Japanese
Immigrants from Laos
61.5%
COLLEGE, UNDER 1 YEAR
0.4/ 100
METRIC RATING
253rd/ 347
METRIC RANK
61.3%
COLLEGE, UNDER 1 YEAR
0.3/ 100
METRIC RATING
257th/ 347
METRIC RANK
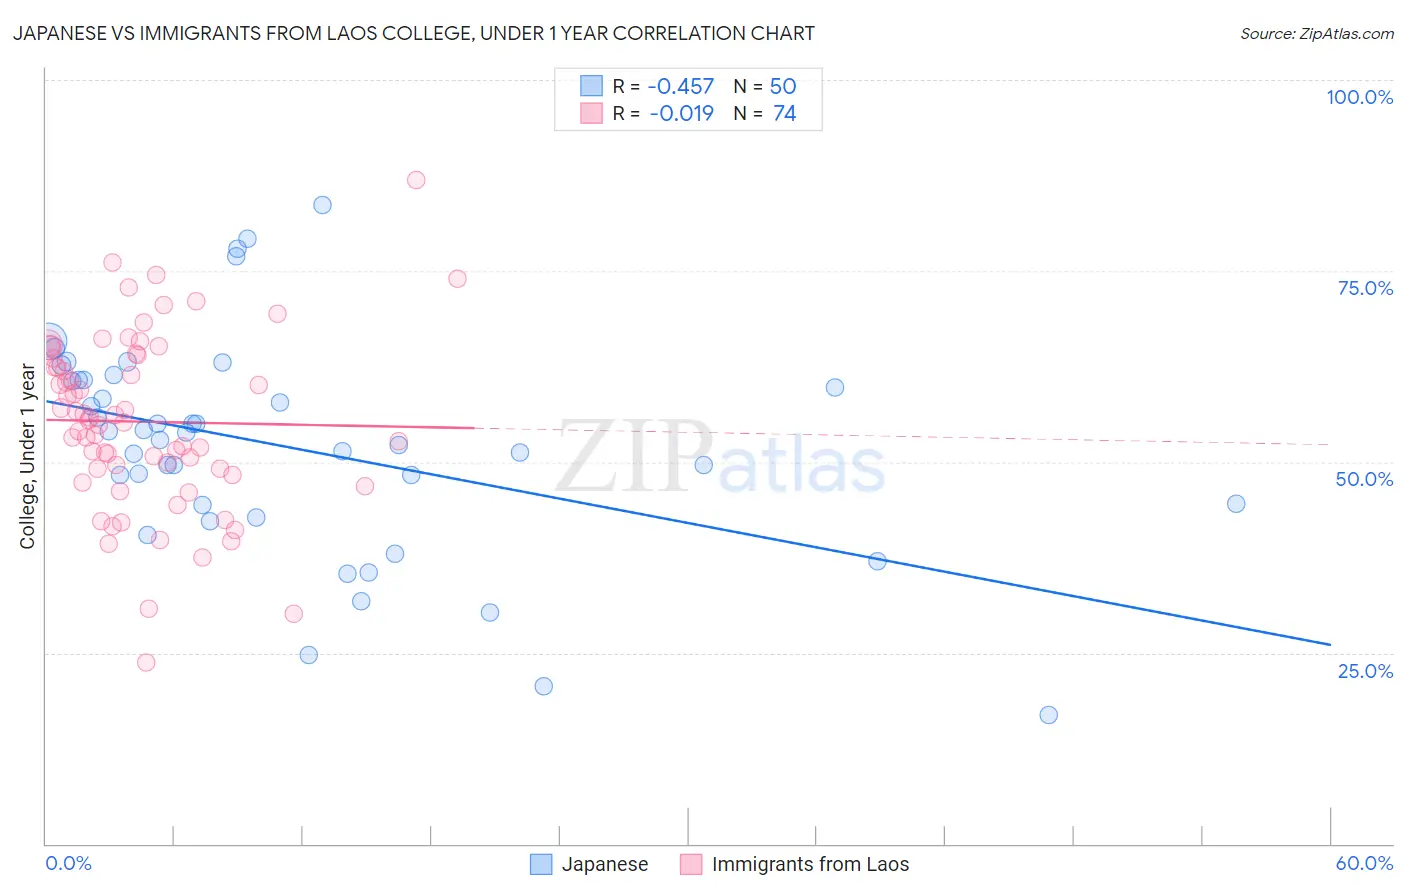
Japanese vs Immigrants from Laos College, Under 1 year Correlation Chart
The statistical analysis conducted on geographies consisting of 249,181,552 people shows a moderate negative correlation between the proportion of Japanese and percentage of population with at least college, under 1 year education in the United States with a correlation coefficient (R) of -0.457 and weighted average of 61.5%. Similarly, the statistical analysis conducted on geographies consisting of 201,475,732 people shows no correlation between the proportion of Immigrants from Laos and percentage of population with at least college, under 1 year education in the United States with a correlation coefficient (R) of -0.019 and weighted average of 61.3%, a difference of 0.28%.
College, Under 1 year Correlation Summary
| Measurement | Japanese | Immigrants from Laos |
| Minimum | 16.8% | 23.8% |
| Maximum | 83.7% | 86.9% |
| Range | 66.8% | 63.2% |
| Mean | 51.9% | 55.2% |
| Median | 53.4% | 55.3% |
| Interquartile 25% (IQ1) | 44.3% | 49.0% |
| Interquartile 75% (IQ3) | 60.8% | 63.6% |
| Interquartile Range (IQR) | 16.5% | 14.5% |
| Standard Deviation (Sample) | 14.1% | 11.4% |
| Standard Deviation (Population) | 13.9% | 11.4% |
Demographics Similar to Japanese and Immigrants from Laos by College, Under 1 year
In terms of college, under 1 year, the demographic groups most similar to Japanese are West Indian (61.5%, a difference of 0.0%), Immigrants from Cambodia (61.5%, a difference of 0.0%), Immigrants from Micronesia (61.5%, a difference of 0.11%), Comanche (61.4%, a difference of 0.13%), and Bangladeshi (61.4%, a difference of 0.17%). Similarly, the demographic groups most similar to Immigrants from Laos are Immigrants from Bangladesh (61.3%, a difference of 0.060%), Indonesian (61.2%, a difference of 0.080%), Bangladeshi (61.4%, a difference of 0.11%), Comanche (61.4%, a difference of 0.16%), and Blackfeet (61.1%, a difference of 0.25%).
| Demographics | Rating | Rank | College, Under 1 year |
| Delaware | 0.9 /100 | #245 | Tragic 62.1% |
| Marshallese | 0.8 /100 | #246 | Tragic 61.9% |
| Immigrants | Liberia | 0.8 /100 | #247 | Tragic 61.9% |
| Potawatomi | 0.6 /100 | #248 | Tragic 61.8% |
| Vietnamese | 0.5 /100 | #249 | Tragic 61.7% |
| Immigrants | Congo | 0.5 /100 | #250 | Tragic 61.7% |
| Immigrants | Micronesia | 0.5 /100 | #251 | Tragic 61.5% |
| West Indians | 0.4 /100 | #252 | Tragic 61.5% |
| Japanese | 0.4 /100 | #253 | Tragic 61.5% |
| Immigrants | Cambodia | 0.4 /100 | #254 | Tragic 61.5% |
| Comanche | 0.4 /100 | #255 | Tragic 61.4% |
| Bangladeshis | 0.4 /100 | #256 | Tragic 61.4% |
| Immigrants | Laos | 0.3 /100 | #257 | Tragic 61.3% |
| Immigrants | Bangladesh | 0.3 /100 | #258 | Tragic 61.3% |
| Indonesians | 0.3 /100 | #259 | Tragic 61.2% |
| Blackfeet | 0.3 /100 | #260 | Tragic 61.1% |
| Africans | 0.3 /100 | #261 | Tragic 61.1% |
| Barbadians | 0.2 /100 | #262 | Tragic 61.1% |
| Shoshone | 0.2 /100 | #263 | Tragic 61.1% |
| Trinidadians and Tobagonians | 0.2 /100 | #264 | Tragic 61.1% |
| Immigrants | Bahamas | 0.2 /100 | #265 | Tragic 61.1% |