Immigrants from Senegal vs South American GED/Equivalency

COMPARE

Immigrants from Senegal
Race
Ancestry
AfghanAfricanAlaska NativeAlaskan AthabascanAlbanianAleutAlsatianAmericanApacheArabArapahoArgentineanArmenianAssyrian/Chaldean/SyriacAustralianAustrianBahamianBangladeshiBarbadianBasqueBelgianBelizeanBermudanBhutaneseBlackfeetBolivianBrazilianBritishBritish West IndianBulgarianBurmeseCajunCambodianCanadianCape VerdeanCarpatho RusynCelticCentral AmericanCentral American IndianCherokeeCheyenneChickasawChileanChineseChippewaChoctawColombianColvilleComancheCosta RicanCreeCreekCroatianCrowCubanCypriotCzechCzechoslovakianDanishDelawareDominicanDutchDutch West IndianEastern EuropeanEcuadorianEgyptianEnglishEstonianEthiopianEuropeanFijianFilipinoFinnishFrenchFrench American IndianFrench CanadianGermanGerman RussianGhanaianGreekGuamanian/ChamorroGuatemalanGuyaneseHaitianHmongHonduranHopiHoumaHungarianIcelanderIndian (Asian)IndonesianInupiatIranianIraqiIrishIroquoisIsraeliItalianJamaicanJapaneseJordanianKenyanKiowaKoreanLaotianLatvianLebaneseLiberianLithuanianLumbeeLuxembourgerMacedonianMalaysianMalteseMarshalleseMenomineeMexicanMexican American IndianMongolianMoroccanNative HawaiianNavajoNepaleseNew ZealanderNicaraguanNigerianNorthern EuropeanNorwegianOkinawanOsageOttawaPaiutePakistaniPalestinianPanamanianParaguayanPennsylvania GermanPeruvianPimaPolishPortuguesePotawatomiPuebloPuerto RicanPuget Sound SalishRomanianRussianSalvadoranSamoanScandinavianScotch-IrishScottishSeminoleSenegaleseSerbianShoshoneSierra LeoneanSiouxSlavicSlovakSloveneSomaliSouth AfricanSouth American IndianSoviet UnionSpaniardSpanishSpanish AmericanSpanish American IndianSri LankanSubsaharan AfricanSudaneseSwedishSwissSyrianTaiwaneseThaiTlingit-HaidaTohono O'OdhamTonganTrinidadian and TobagonianTsimshianTurkishU.S. Virgin IslanderUgandanUkrainianUruguayanUteVenezuelanVietnameseWelshWest IndianYakamaYaquiYugoslavianYumanYup'ikZimbabwean
Immigration
NonimmigrantsImmigrantsAfghanistanAfricaAlbaniaArgentinaArmeniaAsiaAustraliaAustriaBahamasBangladeshBarbadosBelarusBelgiumBelizeBoliviaBosnia and HerzegovinaBrazilBulgariaBurma/MyanmarCabo VerdeCambodiaCameroonCanadaCaribbeanCentral AmericaChileChinaColombiaCongoCosta RicaCroatiaCubaCzechoslovakiaDenmarkDominicaDominican RepublicEastern AfricaEastern AsiaEastern EuropeEcuadorEgyptEl SalvadorEnglandEritreaEthiopiaEuropeFijiFranceGermanyGhanaGreeceGrenadaGuatemalaGuyanaHaitiHondurasHong KongHungaryIndiaIndonesiaIranIraqIrelandIsraelItalyJamaicaJapanJordanKazakhstanKenyaKoreaKuwaitLaosLatin AmericaLatviaLebanonLiberiaLithuaniaMalaysiaMexicoMicronesiaMiddle AfricaMoldovaMoroccoNepalNetherlandsNicaraguaNigeriaNorth AmericaNorth MacedoniaNorthern AfricaNorthern EuropeNorwayOceaniaPakistanPanamaPeruPhilippinesPolandPortugalRomaniaRussiaSaudi ArabiaScotlandSenegalSerbiaSierra LeoneSingaporeSomaliaSouth AfricaSouth AmericaSouth Central AsiaSouth Eastern AsiaSouthern EuropeSpainSri LankaSt. Vincent and the GrenadinesSudanSwedenSwitzerlandSyriaTaiwanThailandTrinidad and TobagoTurkeyUgandaUkraineUruguayUzbekistanVenezuelaVietnamWest IndiesWestern AfricaWestern AsiaWestern EuropeYemenZaireZimbabweAzores
South American
Race
Ancestry
AfghanAfricanAlaska NativeAlaskan AthabascanAlbanianAleutAlsatianAmericanApacheArabArapahoArgentineanArmenianAssyrian/Chaldean/SyriacAustralianAustrianBahamianBangladeshiBarbadianBasqueBelgianBelizeanBermudanBhutaneseBlackfeetBolivianBrazilianBritishBritish West IndianBulgarianBurmeseCajunCambodianCanadianCape VerdeanCarpatho RusynCelticCentral AmericanCentral American IndianCherokeeCheyenneChickasawChileanChineseChippewaChoctawColombianColvilleComancheCosta RicanCreeCreekCroatianCrowCubanCypriotCzechCzechoslovakianDanishDelawareDominicanDutchDutch West IndianEastern EuropeanEcuadorianEgyptianEnglishEstonianEthiopianEuropeanFijianFilipinoFinnishFrenchFrench American IndianFrench CanadianGermanGerman RussianGhanaianGreekGuamanian/ChamorroGuatemalanGuyaneseHaitianHmongHonduranHopiHoumaHungarianIcelanderIndian (Asian)IndonesianInupiatIranianIraqiIrishIroquoisIsraeliItalianJamaicanJapaneseJordanianKenyanKiowaKoreanLaotianLatvianLebaneseLiberianLithuanianLumbeeLuxembourgerMacedonianMalaysianMalteseMarshalleseMenomineeMexicanMexican American IndianMongolianMoroccanNative HawaiianNavajoNepaleseNew ZealanderNicaraguanNigerianNorthern EuropeanNorwegianOkinawanOsageOttawaPaiutePakistaniPalestinianPanamanianParaguayanPennsylvania GermanPeruvianPimaPolishPortuguesePotawatomiPuebloPuerto RicanPuget Sound SalishRomanianRussianSalvadoranSamoanScandinavianScotch-IrishScottishSeminoleSenegaleseSerbianShoshoneSierra LeoneanSiouxSlavicSlovakSloveneSomaliSouth AfricanSouth AmericanSouth American IndianSoviet UnionSpaniardSpanishSpanish AmericanSpanish American IndianSri LankanSubsaharan AfricanSudaneseSwedishSwissSyrianTaiwaneseThaiTlingit-HaidaTohono O'OdhamTonganTrinidadian and TobagonianTsimshianTurkishU.S. Virgin IslanderUgandanUkrainianUruguayanUteVenezuelanVietnameseWelshWest IndianYakamaYaquiYugoslavianYumanYup'ikZimbabwean
Immigration
NonimmigrantsImmigrantsAfghanistanAfricaAlbaniaArgentinaArmeniaAsiaAustraliaAustriaBahamasBangladeshBarbadosBelarusBelgiumBelizeBoliviaBosnia and HerzegovinaBrazilBulgariaBurma/MyanmarCabo VerdeCambodiaCameroonCanadaCaribbeanCentral AmericaChileChinaColombiaCongoCosta RicaCroatiaCubaCzechoslovakiaDenmarkDominicaDominican RepublicEastern AfricaEastern AsiaEastern EuropeEcuadorEgyptEl SalvadorEnglandEritreaEthiopiaEuropeFijiFranceGermanyGhanaGreeceGrenadaGuatemalaGuyanaHaitiHondurasHong KongHungaryIndiaIndonesiaIranIraqIrelandIsraelItalyJamaicaJapanJordanKazakhstanKenyaKoreaKuwaitLaosLatin AmericaLatviaLebanonLiberiaLithuaniaMalaysiaMexicoMicronesiaMiddle AfricaMoldovaMoroccoNepalNetherlandsNicaraguaNigeriaNorth AmericaNorth MacedoniaNorthern AfricaNorthern EuropeNorwayOceaniaPakistanPanamaPeruPhilippinesPolandPortugalRomaniaRussiaSaudi ArabiaScotlandSerbiaSierra LeoneSingaporeSomaliaSouth AfricaSouth AmericaSouth Central AsiaSouth Eastern AsiaSouthern EuropeSpainSri LankaSt. Vincent and the GrenadinesSudanSwedenSwitzerlandSyriaTaiwanThailandTrinidad and TobagoTurkeyUgandaUkraineUruguayUzbekistanVenezuelaVietnamWest IndiesWestern AfricaWestern AsiaWestern EuropeYemenZaireZimbabweAzores
GED/Equivalency
Income
Poverty
Unemployment
Labor Participation
Family Structure
Vehicle Availability
Education Level
Disability

GED/Equivalency Comparison

Immigrants from Senegal

South Americans

Tragic
Poor
83.8%
GED/EQUIVALENCY
1.2/ 100
METRIC RATING
245th/ 347
METRIC RANK
84.8%
GED/EQUIVALENCY
10.9/ 100
METRIC RATING
211th/ 347
METRIC RANK

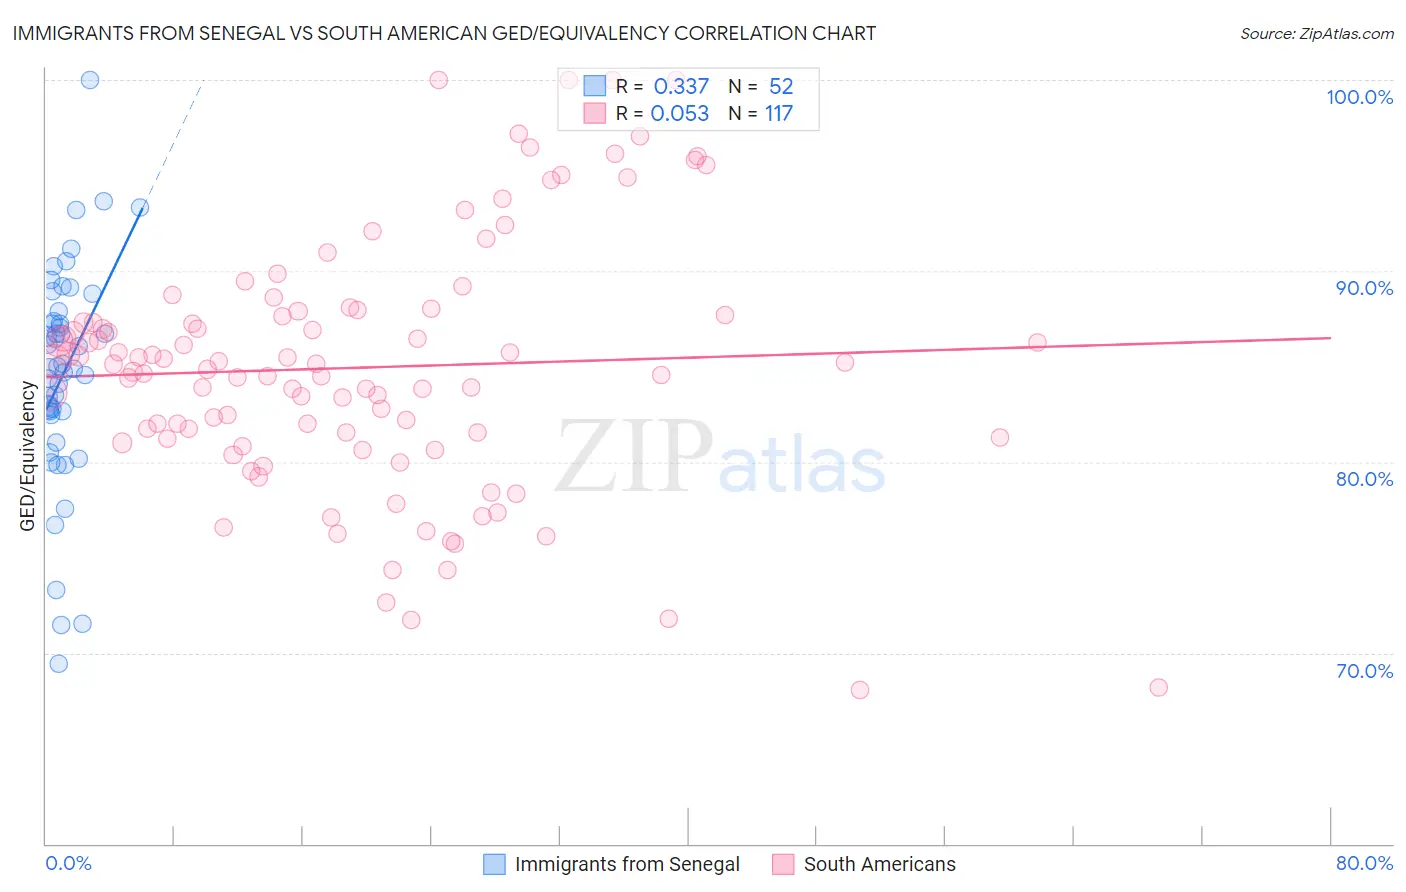
Immigrants from Senegal vs South American GED/Equivalency Correlation Chart

The statistical analysis conducted on geographies consisting of 90,130,297 people shows a mild positive correlation between the proportion of Immigrants from Senegal and percentage of population with at least ged/equivalency education in the United States with a correlation coefficient (R) of 0.337 and weighted average of 83.8%. Similarly, the statistical analysis conducted on geographies consisting of 494,065,729 people shows a slight positive correlation between the proportion of South Americans and percentage of population with at least ged/equivalency education in the United States with a correlation coefficient (R) of 0.053 and weighted average of 84.8%, a difference of 1.2%.
Immigrants from Senegal vs South American GED/Equivalency

GED/Equivalency Correlation Summary

MeasurementImmigrants from SenegalSouth American
Minimum69.5%68.0%
Maximum100.0%100.0%
Range30.5%32.0%
Mean84.7%84.9%
Median85.0%85.1%
Interquartile 25% (IQ1)82.5%81.2%
Interquartile 75% (IQ3)87.6%87.8%
Interquartile Range (IQR)5.1%6.5%
Standard Deviation (Sample)5.8%6.6%
Standard Deviation (Population)5.7%6.6%

Similar Demographics by GED/Equivalency

Demographics Similar to Immigrants from Senegal by GED/Equivalency

In terms of ged/equivalency, the demographic groups most similar to Immigrants from Senegal are Chickasaw (83.8%, a difference of 0.020%), Immigrants from Ghana (83.9%, a difference of 0.030%), Cherokee (83.9%, a difference of 0.040%), Immigrants from Western Africa (83.8%, a difference of 0.050%), and Blackfeet (83.8%, a difference of 0.070%).
DemographicsRating | RankGED/Equivalency
Immigrants | Peru
2.7
/100
|
#238
Tragic
84.2%
Immigrants | Bahamas
2.6
/100
|
#239
Tragic
84.2%
Immigrants | South Eastern Asia
2.5
/100
|
#240
Tragic
84.1%
Senegalese
1.9
/100
|
#241
Tragic
84.0%
Sri Lankans
1.9
/100
|
#242
Tragic
84.0%
Cherokee
1.3
/100
|
#243
Tragic
83.9%
Immigrants | Ghana
1.3
/100
|
#244
Tragic
83.9%
Immigrants | Senegal
1.2
/100
|
#245
Tragic
83.8%
Chickasaw
1.2
/100
|
#246
Tragic
83.8%
Immigrants | Western Africa
1.1
/100
|
#247
Tragic
83.8%
Blackfeet
1.1
/100
|
#248
Tragic
83.8%
Crow
1.1
/100
|
#249
Tragic
83.8%
Shoshone
1.0
/100
|
#250
Tragic
83.7%
Spanish Americans
0.8
/100
|
#251
Tragic
83.6%
Bahamians
0.8
/100
|
#252
Tragic
83.6%

Demographics Similar to South Americans by GED/Equivalency

In terms of ged/equivalency, the demographic groups most similar to South Americans are Immigrants from Somalia (84.8%, a difference of 0.020%), Immigrants from Philippines (84.8%, a difference of 0.050%), Immigrants from Cameroon (84.9%, a difference of 0.060%), Colombian (84.9%, a difference of 0.070%), and Marshallese (84.9%, a difference of 0.080%).
DemographicsRating | RankGED/Equivalency
Hawaiians
15.2
/100
|
#204
Poor
85.0%
Liberians
14.6
/100
|
#205
Poor
85.0%
Samoans
13.7
/100
|
#206
Poor
84.9%
Hmong
13.1
/100
|
#207
Poor
84.9%
Marshallese
12.5
/100
|
#208
Poor
84.9%
Colombians
12.3
/100
|
#209
Poor
84.9%
Immigrants | Cameroon
12.1
/100
|
#210
Poor
84.9%
South Americans
10.9
/100
|
#211
Poor
84.8%
Immigrants | Somalia
10.6
/100
|
#212
Poor
84.8%
Immigrants | Philippines
10.0
/100
|
#213
Poor
84.8%
Osage
9.5
/100
|
#214
Tragic
84.8%
Peruvians
9.2
/100
|
#215
Tragic
84.7%
Immigrants | Micronesia
8.7
/100
|
#216
Tragic
84.7%
Nigerians
8.6
/100
|
#217
Tragic
84.7%
Alaska Natives
8.6
/100
|
#218
Tragic
84.7%