Tlingit-Haida vs Malaysian No Schooling Completed
COMPARE
Tlingit-Haida
Malaysian
No Schooling Completed
No Schooling Completed Comparison
Tlingit-Haida
Malaysians
1.5%
NO SCHOOLING COMPLETED
100.0/ 100
METRIC RATING
15th/ 347
METRIC RANK
2.8%
NO SCHOOLING COMPLETED
0.0/ 100
METRIC RATING
293rd/ 347
METRIC RANK
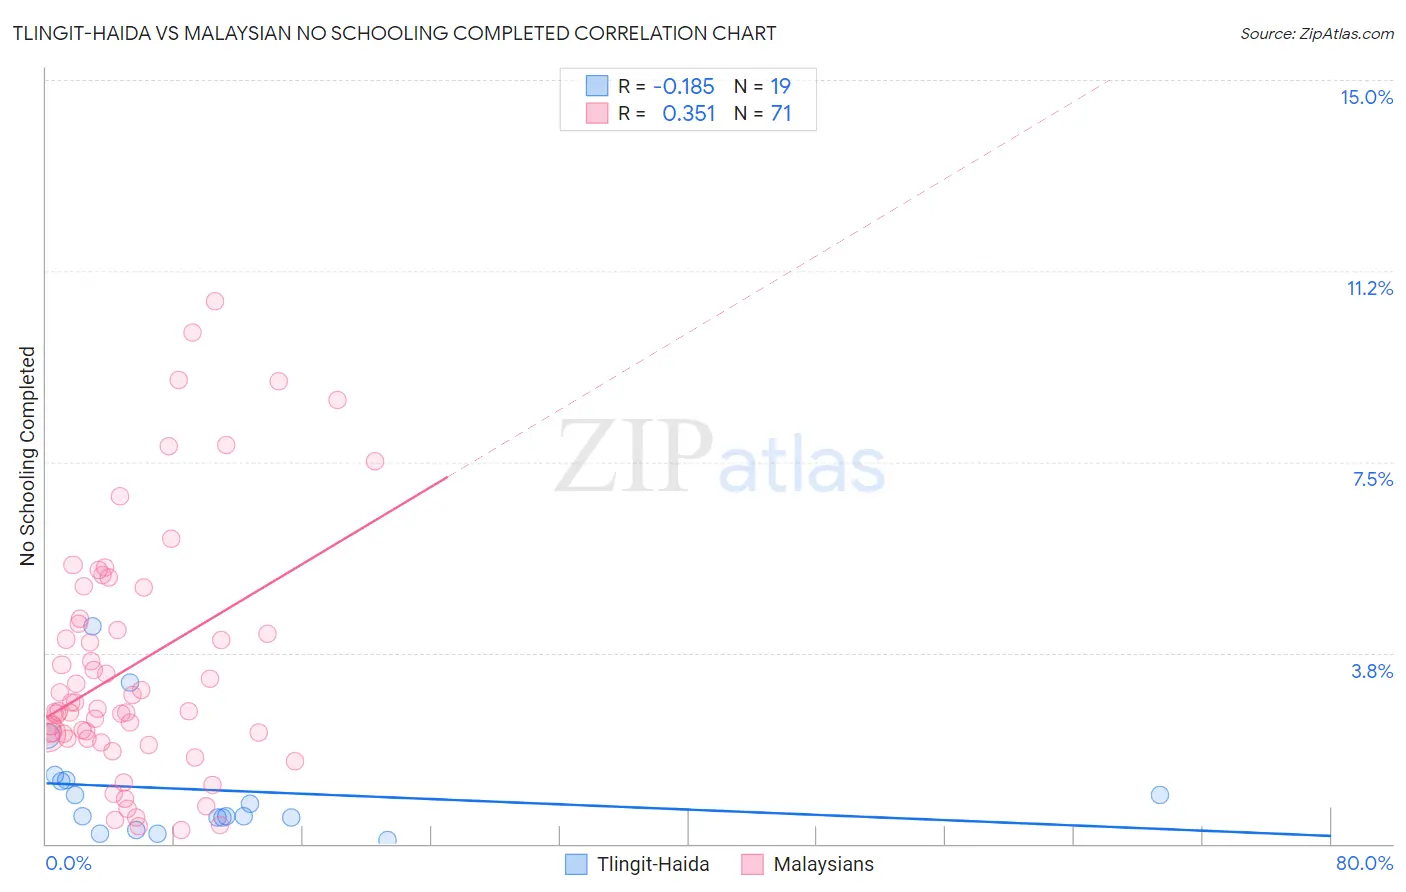
Tlingit-Haida vs Malaysian No Schooling Completed Correlation Chart
The statistical analysis conducted on geographies consisting of 60,521,885 people shows a poor negative correlation between the proportion of Tlingit-Haida and percentage of population with no schooling in the United States with a correlation coefficient (R) of -0.185 and weighted average of 1.5%. Similarly, the statistical analysis conducted on geographies consisting of 225,077,175 people shows a mild positive correlation between the proportion of Malaysians and percentage of population with no schooling in the United States with a correlation coefficient (R) of 0.351 and weighted average of 2.8%, a difference of 90.6%.
No Schooling Completed Correlation Summary
| Measurement | Tlingit-Haida | Malaysian |
| Minimum | 0.064% | 0.27% |
| Maximum | 4.3% | 10.6% |
| Range | 4.2% | 10.4% |
| Mean | 1.1% | 3.5% |
| Median | 0.55% | 2.7% |
| Interquartile 25% (IQ1) | 0.51% | 2.1% |
| Interquartile 75% (IQ3) | 1.2% | 4.4% |
| Interquartile Range (IQR) | 0.74% | 2.4% |
| Standard Deviation (Sample) | 1.1% | 2.4% |
| Standard Deviation (Population) | 1.0% | 2.4% |
Similar Demographics by No Schooling Completed
Demographics Similar to Tlingit-Haida by No Schooling Completed
In terms of no schooling completed, the demographic groups most similar to Tlingit-Haida are Scotch-Irish (1.5%, a difference of 0.060%), Finnish (1.5%, a difference of 0.52%), Croatian (1.5%, a difference of 0.53%), Danish (1.5%, a difference of 0.84%), and Alaskan Athabascan (1.5%, a difference of 0.94%).
| Demographics | Rating | Rank | No Schooling Completed |
| Swedes | 100.0 /100 | #8 | Exceptional 1.4% |
| Scottish | 100.0 /100 | #9 | Exceptional 1.4% |
| Dutch | 100.0 /100 | #10 | Exceptional 1.4% |
| Lithuanians | 100.0 /100 | #11 | Exceptional 1.4% |
| Irish | 100.0 /100 | #12 | Exceptional 1.4% |
| Poles | 100.0 /100 | #13 | Exceptional 1.4% |
| Scotch-Irish | 100.0 /100 | #14 | Exceptional 1.5% |
| Tlingit-Haida | 100.0 /100 | #15 | Exceptional 1.5% |
| Finns | 100.0 /100 | #16 | Exceptional 1.5% |
| Croatians | 100.0 /100 | #17 | Exceptional 1.5% |
| Danes | 100.0 /100 | #18 | Exceptional 1.5% |
| Alaskan Athabascans | 100.0 /100 | #19 | Exceptional 1.5% |
| Welsh | 100.0 /100 | #20 | Exceptional 1.5% |
| Chinese | 100.0 /100 | #21 | Exceptional 1.5% |
| Alaska Natives | 100.0 /100 | #22 | Exceptional 1.5% |
Demographics Similar to Malaysians by No Schooling Completed
In terms of no schooling completed, the demographic groups most similar to Malaysians are Immigrants from Eritrea (2.8%, a difference of 0.17%), Immigrants from Grenada (2.8%, a difference of 0.41%), Houma (2.8%, a difference of 0.69%), Immigrants (2.8%, a difference of 0.79%), and British West Indian (2.7%, a difference of 1.5%).
| Demographics | Rating | Rank | No Schooling Completed |
| Immigrants | Portugal | 0.0 /100 | #286 | Tragic 2.7% |
| Immigrants | Afghanistan | 0.0 /100 | #287 | Tragic 2.7% |
| Immigrants | St. Vincent and the Grenadines | 0.0 /100 | #288 | Tragic 2.7% |
| Immigrants | Thailand | 0.0 /100 | #289 | Tragic 2.7% |
| Immigrants | Hong Kong | 0.0 /100 | #290 | Tragic 2.7% |
| British West Indians | 0.0 /100 | #291 | Tragic 2.7% |
| Immigrants | Grenada | 0.0 /100 | #292 | Tragic 2.8% |
| Malaysians | 0.0 /100 | #293 | Tragic 2.8% |
| Immigrants | Eritrea | 0.0 /100 | #294 | Tragic 2.8% |
| Houma | 0.0 /100 | #295 | Tragic 2.8% |
| Immigrants | Immigrants | 0.0 /100 | #296 | Tragic 2.8% |
| Immigrants | Cuba | 0.0 /100 | #297 | Tragic 2.8% |
| Immigrants | Dominica | 0.0 /100 | #298 | Tragic 2.8% |
| Central American Indians | 0.0 /100 | #299 | Tragic 2.8% |
| Haitians | 0.0 /100 | #300 | Tragic 2.9% |