Tlingit-Haida vs Korean No Schooling Completed
COMPARE
Tlingit-Haida
Korean
No Schooling Completed
No Schooling Completed Comparison
Tlingit-Haida
Koreans
1.5%
NO SCHOOLING COMPLETED
100.0/ 100
METRIC RATING
15th/ 347
METRIC RANK
2.4%
NO SCHOOLING COMPLETED
1.7/ 100
METRIC RATING
241st/ 347
METRIC RANK
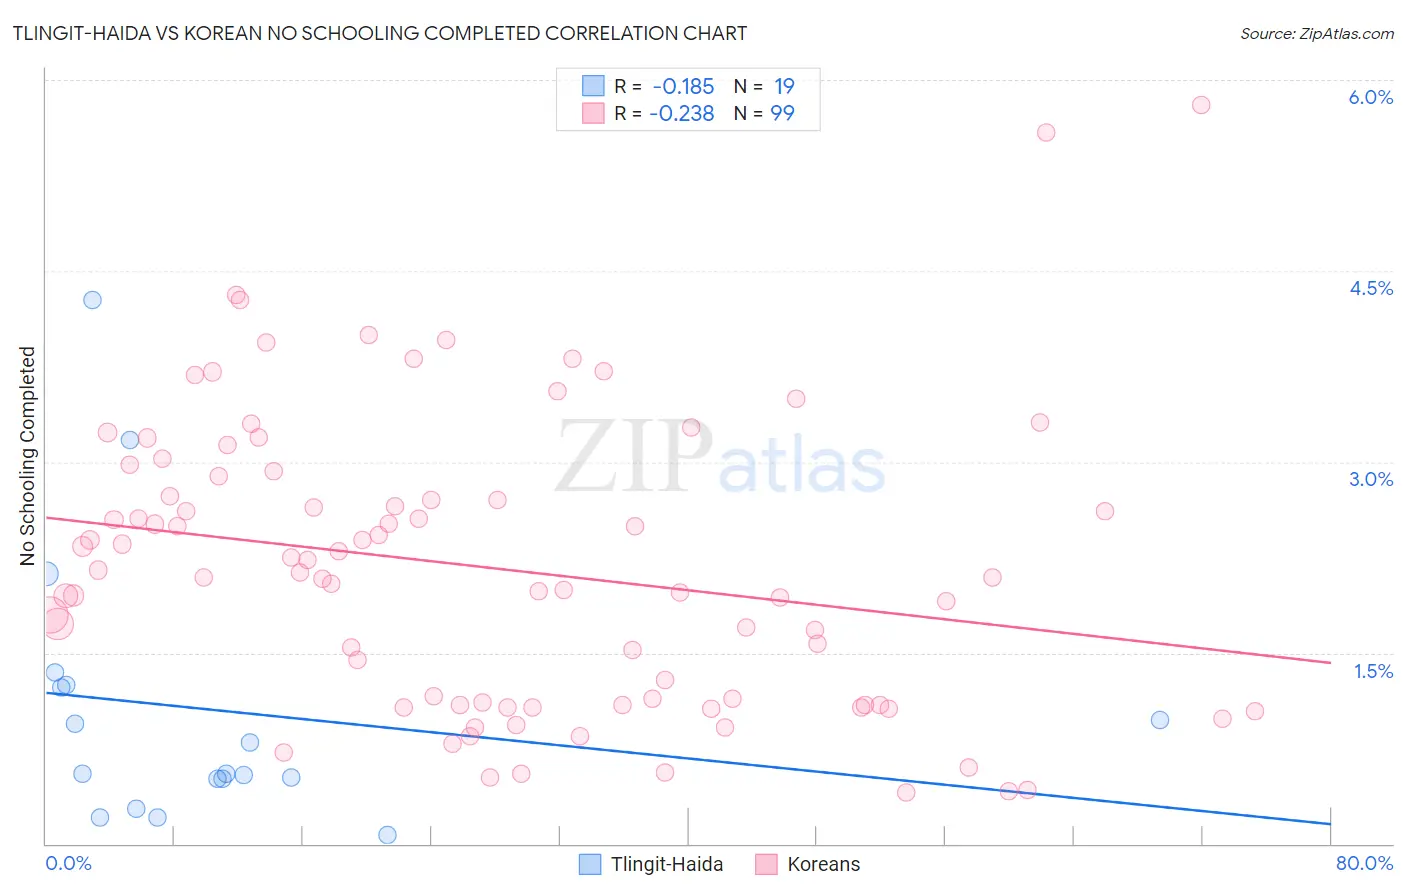
Tlingit-Haida vs Korean No Schooling Completed Correlation Chart
The statistical analysis conducted on geographies consisting of 60,521,885 people shows a poor negative correlation between the proportion of Tlingit-Haida and percentage of population with no schooling in the United States with a correlation coefficient (R) of -0.185 and weighted average of 1.5%. Similarly, the statistical analysis conducted on geographies consisting of 502,061,970 people shows a weak negative correlation between the proportion of Koreans and percentage of population with no schooling in the United States with a correlation coefficient (R) of -0.238 and weighted average of 2.4%, a difference of 63.7%.
No Schooling Completed Correlation Summary
| Measurement | Tlingit-Haida | Korean |
| Minimum | 0.064% | 0.40% |
| Maximum | 4.3% | 5.8% |
| Range | 4.2% | 5.4% |
| Mean | 1.1% | 2.2% |
| Median | 0.55% | 2.1% |
| Interquartile 25% (IQ1) | 0.51% | 1.1% |
| Interquartile 75% (IQ3) | 1.2% | 2.9% |
| Interquartile Range (IQR) | 0.74% | 1.8% |
| Standard Deviation (Sample) | 1.1% | 1.1% |
| Standard Deviation (Population) | 1.0% | 1.1% |
Similar Demographics by No Schooling Completed
Demographics Similar to Tlingit-Haida by No Schooling Completed
In terms of no schooling completed, the demographic groups most similar to Tlingit-Haida are Scotch-Irish (1.5%, a difference of 0.060%), Finnish (1.5%, a difference of 0.52%), Croatian (1.5%, a difference of 0.53%), Danish (1.5%, a difference of 0.84%), and Alaskan Athabascan (1.5%, a difference of 0.94%).
| Demographics | Rating | Rank | No Schooling Completed |
| Swedes | 100.0 /100 | #8 | Exceptional 1.4% |
| Scottish | 100.0 /100 | #9 | Exceptional 1.4% |
| Dutch | 100.0 /100 | #10 | Exceptional 1.4% |
| Lithuanians | 100.0 /100 | #11 | Exceptional 1.4% |
| Irish | 100.0 /100 | #12 | Exceptional 1.4% |
| Poles | 100.0 /100 | #13 | Exceptional 1.4% |
| Scotch-Irish | 100.0 /100 | #14 | Exceptional 1.5% |
| Tlingit-Haida | 100.0 /100 | #15 | Exceptional 1.5% |
| Finns | 100.0 /100 | #16 | Exceptional 1.5% |
| Croatians | 100.0 /100 | #17 | Exceptional 1.5% |
| Danes | 100.0 /100 | #18 | Exceptional 1.5% |
| Alaskan Athabascans | 100.0 /100 | #19 | Exceptional 1.5% |
| Welsh | 100.0 /100 | #20 | Exceptional 1.5% |
| Chinese | 100.0 /100 | #21 | Exceptional 1.5% |
| Alaska Natives | 100.0 /100 | #22 | Exceptional 1.5% |
Demographics Similar to Koreans by No Schooling Completed
In terms of no schooling completed, the demographic groups most similar to Koreans are Immigrants from Senegal (2.4%, a difference of 0.060%), Liberian (2.4%, a difference of 0.29%), Immigrants from Indonesia (2.4%, a difference of 0.32%), South American (2.4%, a difference of 0.36%), and Paiute (2.4%, a difference of 0.41%).
| Demographics | Rating | Rank | No Schooling Completed |
| Nigerians | 2.6 /100 | #234 | Tragic 2.3% |
| Immigrants | Western Asia | 2.6 /100 | #235 | Tragic 2.3% |
| Iraqis | 2.2 /100 | #236 | Tragic 2.4% |
| Immigrants | Eastern Asia | 2.0 /100 | #237 | Tragic 2.4% |
| Paiute | 1.9 /100 | #238 | Tragic 2.4% |
| Liberians | 1.8 /100 | #239 | Tragic 2.4% |
| Immigrants | Senegal | 1.7 /100 | #240 | Tragic 2.4% |
| Koreans | 1.7 /100 | #241 | Tragic 2.4% |
| Immigrants | Indonesia | 1.5 /100 | #242 | Tragic 2.4% |
| South Americans | 1.5 /100 | #243 | Tragic 2.4% |
| Peruvians | 1.4 /100 | #244 | Tragic 2.4% |
| Bolivians | 1.4 /100 | #245 | Tragic 2.4% |
| Immigrants | Congo | 1.4 /100 | #246 | Tragic 2.4% |
| Immigrants | Iraq | 1.3 /100 | #247 | Tragic 2.4% |
| Asians | 1.2 /100 | #248 | Tragic 2.4% |