Canadian vs Immigrants from Oceania No Schooling Completed
COMPARE
Canadian
Immigrants from Oceania
No Schooling Completed
No Schooling Completed Comparison
Canadians
Immigrants from Oceania
1.7%
NO SCHOOLING COMPLETED
99.7/ 100
METRIC RATING
66th/ 347
METRIC RANK
2.2%
NO SCHOOLING COMPLETED
10.2/ 100
METRIC RATING
209th/ 347
METRIC RANK
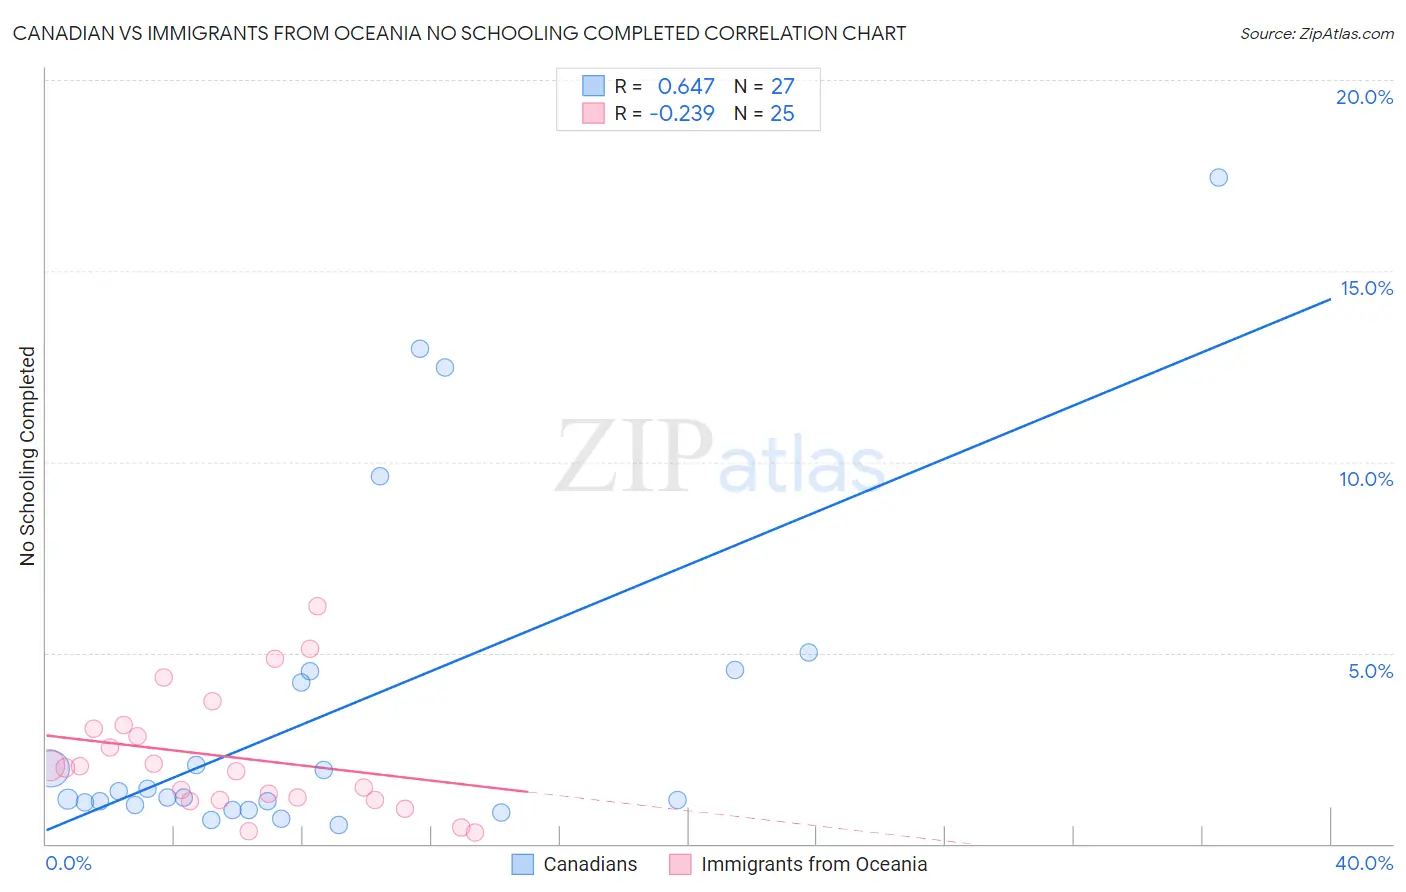
Canadian vs Immigrants from Oceania No Schooling Completed Correlation Chart
The statistical analysis conducted on geographies consisting of 430,389,571 people shows a significant positive correlation between the proportion of Canadians and percentage of population with no schooling in the United States with a correlation coefficient (R) of 0.647 and weighted average of 1.7%. Similarly, the statistical analysis conducted on geographies consisting of 302,492,399 people shows a weak negative correlation between the proportion of Immigrants from Oceania and percentage of population with no schooling in the United States with a correlation coefficient (R) of -0.239 and weighted average of 2.2%, a difference of 34.0%.
No Schooling Completed Correlation Summary
| Measurement | Canadian | Immigrants from Oceania |
| Minimum | 0.49% | 0.28% |
| Maximum | 17.5% | 6.2% |
| Range | 17.0% | 5.9% |
| Mean | 3.4% | 2.3% |
| Median | 1.2% | 2.0% |
| Interquartile 25% (IQ1) | 1.0% | 1.1% |
| Interquartile 75% (IQ3) | 4.5% | 3.1% |
| Interquartile Range (IQR) | 3.5% | 1.9% |
| Standard Deviation (Sample) | 4.4% | 1.6% |
| Standard Deviation (Population) | 4.4% | 1.5% |
Similar Demographics by No Schooling Completed
Demographics Similar to Canadians by No Schooling Completed
In terms of no schooling completed, the demographic groups most similar to Canadians are Serbian (1.7%, a difference of 0.14%), New Zealander (1.7%, a difference of 0.18%), Immigrants from Austria (1.7%, a difference of 0.19%), Russian (1.7%, a difference of 0.34%), and Immigrants from Northern Europe (1.7%, a difference of 0.38%).
| Demographics | Rating | Rank | No Schooling Completed |
| Slavs | 99.8 /100 | #59 | Exceptional 1.7% |
| Americans | 99.8 /100 | #60 | Exceptional 1.7% |
| Tsimshian | 99.8 /100 | #61 | Exceptional 1.7% |
| Immigrants | Northern Europe | 99.8 /100 | #62 | Exceptional 1.7% |
| Russians | 99.8 /100 | #63 | Exceptional 1.7% |
| New Zealanders | 99.7 /100 | #64 | Exceptional 1.7% |
| Serbians | 99.7 /100 | #65 | Exceptional 1.7% |
| Canadians | 99.7 /100 | #66 | Exceptional 1.7% |
| Immigrants | Austria | 99.7 /100 | #67 | Exceptional 1.7% |
| Immigrants | Lithuania | 99.7 /100 | #68 | Exceptional 1.7% |
| Chickasaw | 99.6 /100 | #69 | Exceptional 1.7% |
| Immigrants | Netherlands | 99.6 /100 | #70 | Exceptional 1.7% |
| Immigrants | England | 99.5 /100 | #71 | Exceptional 1.7% |
| Cajuns | 99.5 /100 | #72 | Exceptional 1.7% |
| Immigrants | India | 99.4 /100 | #73 | Exceptional 1.7% |
Demographics Similar to Immigrants from Oceania by No Schooling Completed
In terms of no schooling completed, the demographic groups most similar to Immigrants from Oceania are Native/Alaskan (2.2%, a difference of 0.070%), Uruguayan (2.2%, a difference of 0.25%), South American Indian (2.2%, a difference of 0.26%), Bahamian (2.2%, a difference of 0.44%), and Immigrants from Bahamas (2.2%, a difference of 0.45%).
| Demographics | Rating | Rank | No Schooling Completed |
| Moroccans | 13.7 /100 | #202 | Poor 2.2% |
| Laotians | 13.3 /100 | #203 | Poor 2.2% |
| Hopi | 12.9 /100 | #204 | Poor 2.2% |
| Immigrants | Bahamas | 11.6 /100 | #205 | Poor 2.2% |
| Bahamians | 11.6 /100 | #206 | Poor 2.2% |
| South American Indians | 11.0 /100 | #207 | Poor 2.2% |
| Uruguayans | 11.0 /100 | #208 | Poor 2.2% |
| Immigrants | Oceania | 10.2 /100 | #209 | Poor 2.2% |
| Natives/Alaskans | 10.0 /100 | #210 | Tragic 2.2% |
| Immigrants | Panama | 8.8 /100 | #211 | Tragic 2.3% |
| Immigrants | Morocco | 8.7 /100 | #212 | Tragic 2.3% |
| Ute | 8.2 /100 | #213 | Tragic 2.3% |
| Samoans | 8.2 /100 | #214 | Tragic 2.3% |
| Immigrants | Zaire | 7.2 /100 | #215 | Tragic 2.3% |
| Tongans | 6.8 /100 | #216 | Tragic 2.3% |