Tlingit-Haida vs Immigrants from Costa Rica No Schooling Completed
COMPARE
Tlingit-Haida
Immigrants from Costa Rica
No Schooling Completed
No Schooling Completed Comparison
Tlingit-Haida
Immigrants from Costa Rica
1.5%
NO SCHOOLING COMPLETED
100.0/ 100
METRIC RATING
15th/ 347
METRIC RANK
2.3%
NO SCHOOLING COMPLETED
5.1/ 100
METRIC RATING
220th/ 347
METRIC RANK
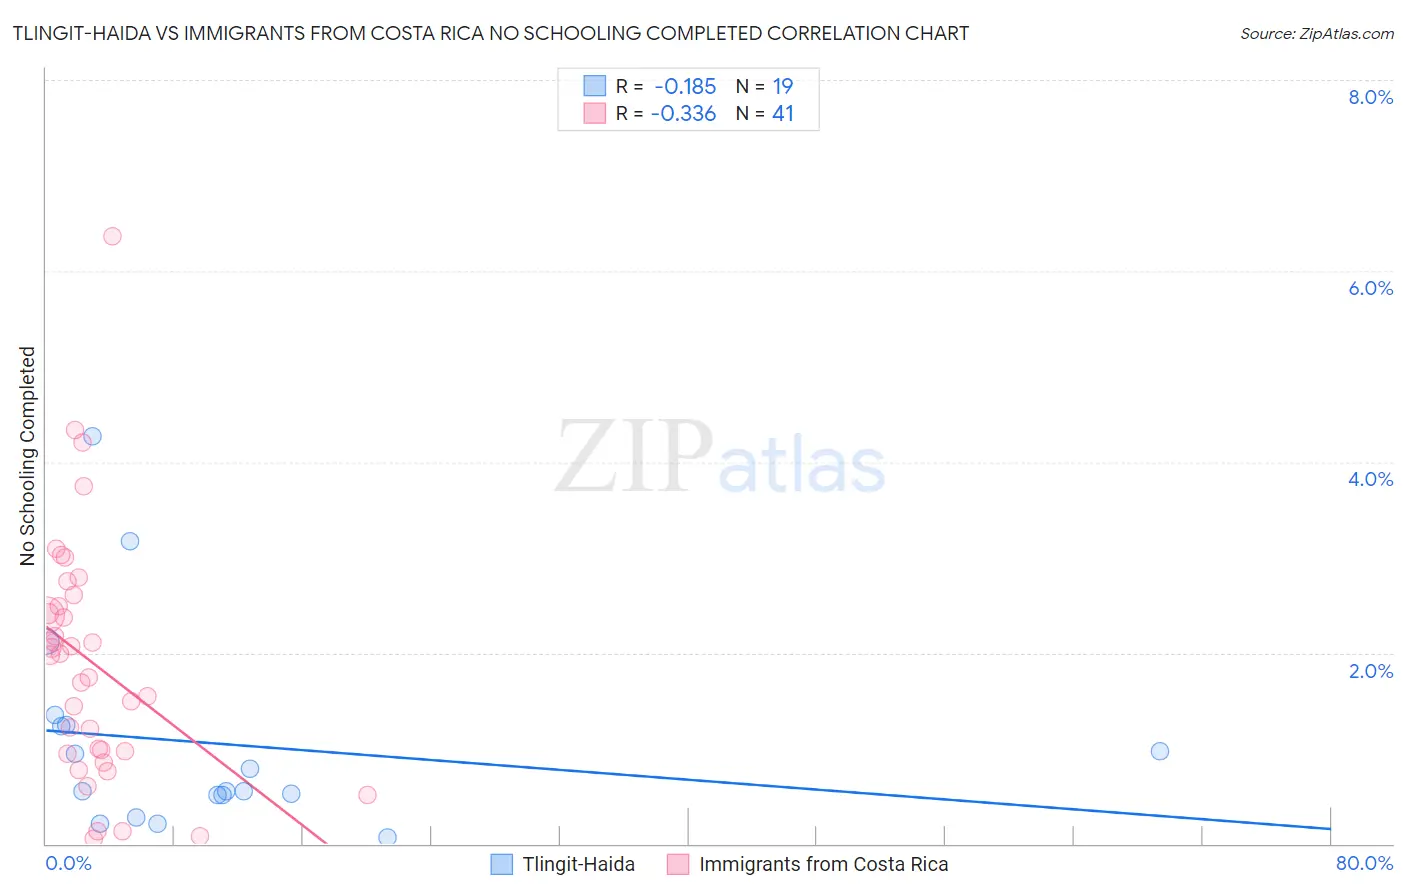
Tlingit-Haida vs Immigrants from Costa Rica No Schooling Completed Correlation Chart
The statistical analysis conducted on geographies consisting of 60,521,885 people shows a poor negative correlation between the proportion of Tlingit-Haida and percentage of population with no schooling in the United States with a correlation coefficient (R) of -0.185 and weighted average of 1.5%. Similarly, the statistical analysis conducted on geographies consisting of 203,672,826 people shows a mild negative correlation between the proportion of Immigrants from Costa Rica and percentage of population with no schooling in the United States with a correlation coefficient (R) of -0.336 and weighted average of 2.3%, a difference of 58.1%.
No Schooling Completed Correlation Summary
| Measurement | Tlingit-Haida | Immigrants from Costa Rica |
| Minimum | 0.064% | 0.047% |
| Maximum | 4.3% | 6.4% |
| Range | 4.2% | 6.3% |
| Mean | 1.1% | 1.9% |
| Median | 0.55% | 2.0% |
| Interquartile 25% (IQ1) | 0.51% | 0.96% |
| Interquartile 75% (IQ3) | 1.2% | 2.5% |
| Interquartile Range (IQR) | 0.74% | 1.6% |
| Standard Deviation (Sample) | 1.1% | 1.3% |
| Standard Deviation (Population) | 1.0% | 1.3% |
Similar Demographics by No Schooling Completed
Demographics Similar to Tlingit-Haida by No Schooling Completed
In terms of no schooling completed, the demographic groups most similar to Tlingit-Haida are Scotch-Irish (1.5%, a difference of 0.060%), Finnish (1.5%, a difference of 0.52%), Croatian (1.5%, a difference of 0.53%), Danish (1.5%, a difference of 0.84%), and Alaskan Athabascan (1.5%, a difference of 0.94%).
| Demographics | Rating | Rank | No Schooling Completed |
| Swedes | 100.0 /100 | #8 | Exceptional 1.4% |
| Scottish | 100.0 /100 | #9 | Exceptional 1.4% |
| Dutch | 100.0 /100 | #10 | Exceptional 1.4% |
| Lithuanians | 100.0 /100 | #11 | Exceptional 1.4% |
| Irish | 100.0 /100 | #12 | Exceptional 1.4% |
| Poles | 100.0 /100 | #13 | Exceptional 1.4% |
| Scotch-Irish | 100.0 /100 | #14 | Exceptional 1.5% |
| Tlingit-Haida | 100.0 /100 | #15 | Exceptional 1.5% |
| Finns | 100.0 /100 | #16 | Exceptional 1.5% |
| Croatians | 100.0 /100 | #17 | Exceptional 1.5% |
| Danes | 100.0 /100 | #18 | Exceptional 1.5% |
| Alaskan Athabascans | 100.0 /100 | #19 | Exceptional 1.5% |
| Welsh | 100.0 /100 | #20 | Exceptional 1.5% |
| Chinese | 100.0 /100 | #21 | Exceptional 1.5% |
| Alaska Natives | 100.0 /100 | #22 | Exceptional 1.5% |
Demographics Similar to Immigrants from Costa Rica by No Schooling Completed
In terms of no schooling completed, the demographic groups most similar to Immigrants from Costa Rica are Immigrants from Sudan (2.3%, a difference of 0.090%), Senegalese (2.3%, a difference of 0.26%), Subsaharan African (2.3%, a difference of 0.26%), Immigrants from Lebanon (2.3%, a difference of 0.42%), and Immigrants from Nepal (2.3%, a difference of 0.70%).
| Demographics | Rating | Rank | No Schooling Completed |
| Ute | 8.2 /100 | #213 | Tragic 2.3% |
| Samoans | 8.2 /100 | #214 | Tragic 2.3% |
| Immigrants | Zaire | 7.2 /100 | #215 | Tragic 2.3% |
| Tongans | 6.8 /100 | #216 | Tragic 2.3% |
| Immigrants | Syria | 6.6 /100 | #217 | Tragic 2.3% |
| Immigrants | Nepal | 6.4 /100 | #218 | Tragic 2.3% |
| Senegalese | 5.6 /100 | #219 | Tragic 2.3% |
| Immigrants | Costa Rica | 5.1 /100 | #220 | Tragic 2.3% |
| Immigrants | Sudan | 5.0 /100 | #221 | Tragic 2.3% |
| Sub-Saharan Africans | 4.7 /100 | #222 | Tragic 2.3% |
| Immigrants | Lebanon | 4.5 /100 | #223 | Tragic 2.3% |
| Tohono O'odham | 4.1 /100 | #224 | Tragic 2.3% |
| Sudanese | 4.1 /100 | #225 | Tragic 2.3% |
| Sierra Leoneans | 4.1 /100 | #226 | Tragic 2.3% |
| Immigrants | Uganda | 4.0 /100 | #227 | Tragic 2.3% |