Bhutanese vs Cuban No Schooling Completed
COMPARE
Bhutanese
Cuban
No Schooling Completed
No Schooling Completed Comparison
Bhutanese
Cubans
1.8%
NO SCHOOLING COMPLETED
98.4/ 100
METRIC RATING
96th/ 347
METRIC RANK
2.5%
NO SCHOOLING COMPLETED
0.2/ 100
METRIC RATING
271st/ 347
METRIC RANK
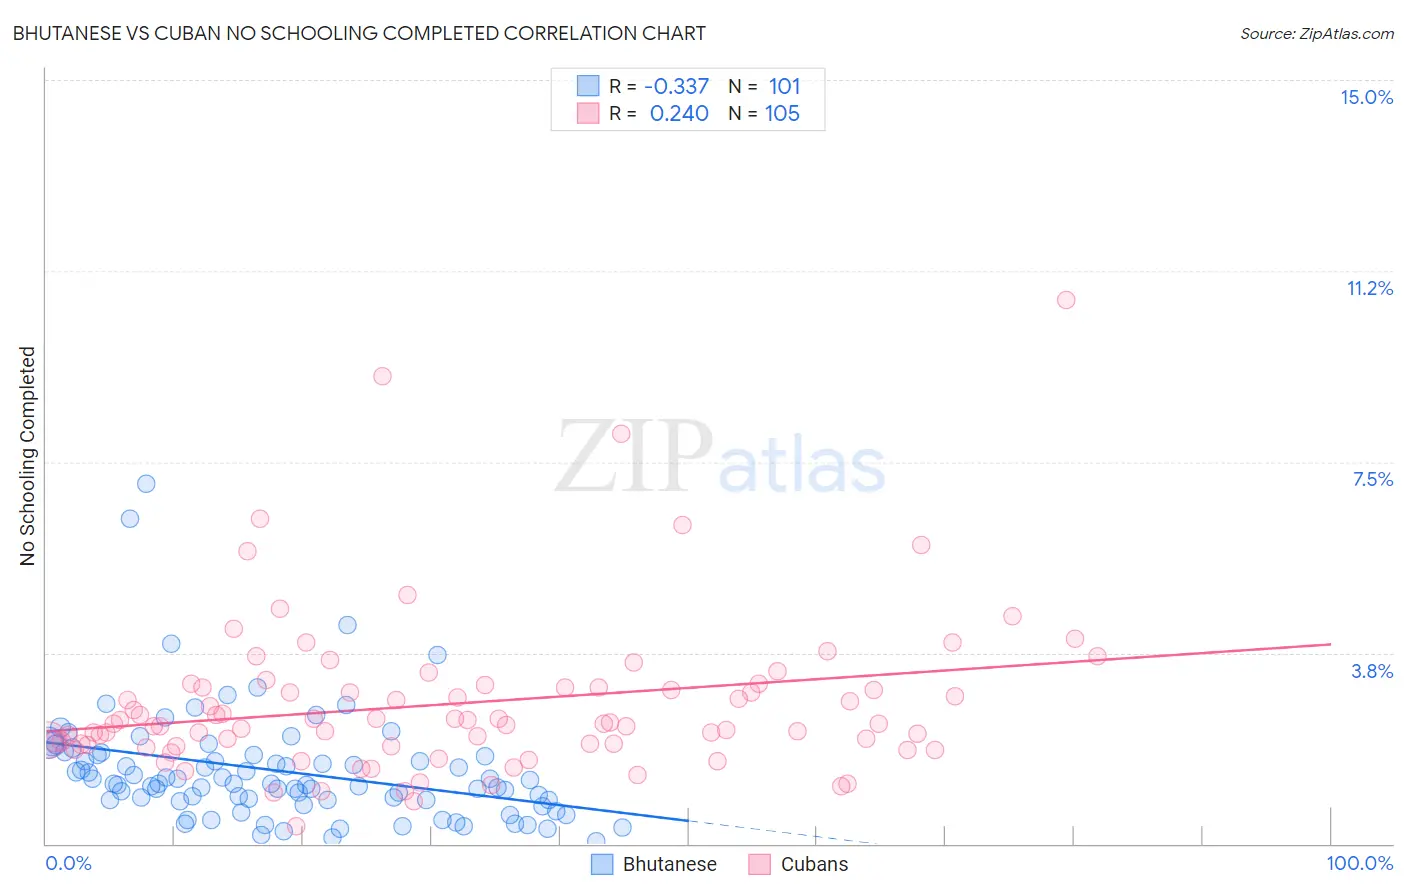
Bhutanese vs Cuban No Schooling Completed Correlation Chart
The statistical analysis conducted on geographies consisting of 448,858,455 people shows a mild negative correlation between the proportion of Bhutanese and percentage of population with no schooling in the United States with a correlation coefficient (R) of -0.337 and weighted average of 1.8%. Similarly, the statistical analysis conducted on geographies consisting of 444,053,579 people shows a weak positive correlation between the proportion of Cubans and percentage of population with no schooling in the United States with a correlation coefficient (R) of 0.240 and weighted average of 2.5%, a difference of 39.7%.
No Schooling Completed Correlation Summary
| Measurement | Bhutanese | Cuban |
| Minimum | 0.048% | 0.33% |
| Maximum | 7.1% | 10.7% |
| Range | 7.0% | 10.4% |
| Mean | 1.4% | 2.8% |
| Median | 1.2% | 2.4% |
| Interquartile 25% (IQ1) | 0.85% | 1.9% |
| Interquartile 75% (IQ3) | 1.7% | 3.1% |
| Interquartile Range (IQR) | 0.89% | 1.1% |
| Standard Deviation (Sample) | 1.1% | 1.6% |
| Standard Deviation (Population) | 1.1% | 1.6% |
Similar Demographics by No Schooling Completed
Demographics Similar to Bhutanese by No Schooling Completed
In terms of no schooling completed, the demographic groups most similar to Bhutanese are Immigrants from Ireland (1.8%, a difference of 0.18%), Puget Sound Salish (1.8%, a difference of 0.23%), Nonimmigrants (1.8%, a difference of 0.24%), Iranian (1.8%, a difference of 0.46%), and Choctaw (1.8%, a difference of 0.65%).
| Demographics | Rating | Rank | No Schooling Completed |
| South Africans | 99.1 /100 | #89 | Exceptional 1.8% |
| Sioux | 99.0 /100 | #90 | Exceptional 1.8% |
| Immigrants | Germany | 99.0 /100 | #91 | Exceptional 1.8% |
| Romanians | 98.8 /100 | #92 | Exceptional 1.8% |
| Turks | 98.7 /100 | #93 | Exceptional 1.8% |
| Immigrants | Nonimmigrants | 98.5 /100 | #94 | Exceptional 1.8% |
| Puget Sound Salish | 98.5 /100 | #95 | Exceptional 1.8% |
| Bhutanese | 98.4 /100 | #96 | Exceptional 1.8% |
| Immigrants | Ireland | 98.4 /100 | #97 | Exceptional 1.8% |
| Iranians | 98.2 /100 | #98 | Exceptional 1.8% |
| Choctaw | 98.1 /100 | #99 | Exceptional 1.8% |
| Immigrants | Singapore | 98.0 /100 | #100 | Exceptional 1.8% |
| Immigrants | Czechoslovakia | 97.9 /100 | #101 | Exceptional 1.8% |
| Immigrants | Switzerland | 97.9 /100 | #102 | Exceptional 1.8% |
| Basques | 97.9 /100 | #103 | Exceptional 1.8% |
Demographics Similar to Cubans by No Schooling Completed
In terms of no schooling completed, the demographic groups most similar to Cubans are Immigrants from Peru (2.5%, a difference of 0.010%), Immigrants from Nigeria (2.5%, a difference of 0.090%), Immigrants from Bolivia (2.5%, a difference of 0.53%), Taiwanese (2.5%, a difference of 0.95%), and Yuman (2.5%, a difference of 1.2%).
| Demographics | Rating | Rank | No Schooling Completed |
| Indians (Asian) | 0.4 /100 | #264 | Tragic 2.5% |
| West Indians | 0.4 /100 | #265 | Tragic 2.5% |
| Fijians | 0.4 /100 | #266 | Tragic 2.5% |
| Yuman | 0.4 /100 | #267 | Tragic 2.5% |
| Taiwanese | 0.3 /100 | #268 | Tragic 2.5% |
| Immigrants | Nigeria | 0.2 /100 | #269 | Tragic 2.5% |
| Immigrants | Peru | 0.2 /100 | #270 | Tragic 2.5% |
| Cubans | 0.2 /100 | #271 | Tragic 2.5% |
| Immigrants | Bolivia | 0.2 /100 | #272 | Tragic 2.5% |
| Immigrants | Cameroon | 0.1 /100 | #273 | Tragic 2.5% |
| Ghanaians | 0.1 /100 | #274 | Tragic 2.6% |
| Immigrants | China | 0.1 /100 | #275 | Tragic 2.6% |
| Immigrants | Western Africa | 0.1 /100 | #276 | Tragic 2.6% |
| Immigrants | Philippines | 0.1 /100 | #277 | Tragic 2.6% |
| Immigrants | Uzbekistan | 0.1 /100 | #278 | Tragic 2.6% |