Immigrants from St. Vincent and the Grenadines vs Cuban No Schooling Completed
COMPARE
Immigrants from St. Vincent and the Grenadines
Cuban
No Schooling Completed
No Schooling Completed Comparison
Immigrants from St. Vincent and the Grenadines
Cubans
2.7%
NO SCHOOLING COMPLETED
0.0/ 100
METRIC RATING
288th/ 347
METRIC RANK
2.5%
NO SCHOOLING COMPLETED
0.2/ 100
METRIC RATING
271st/ 347
METRIC RANK
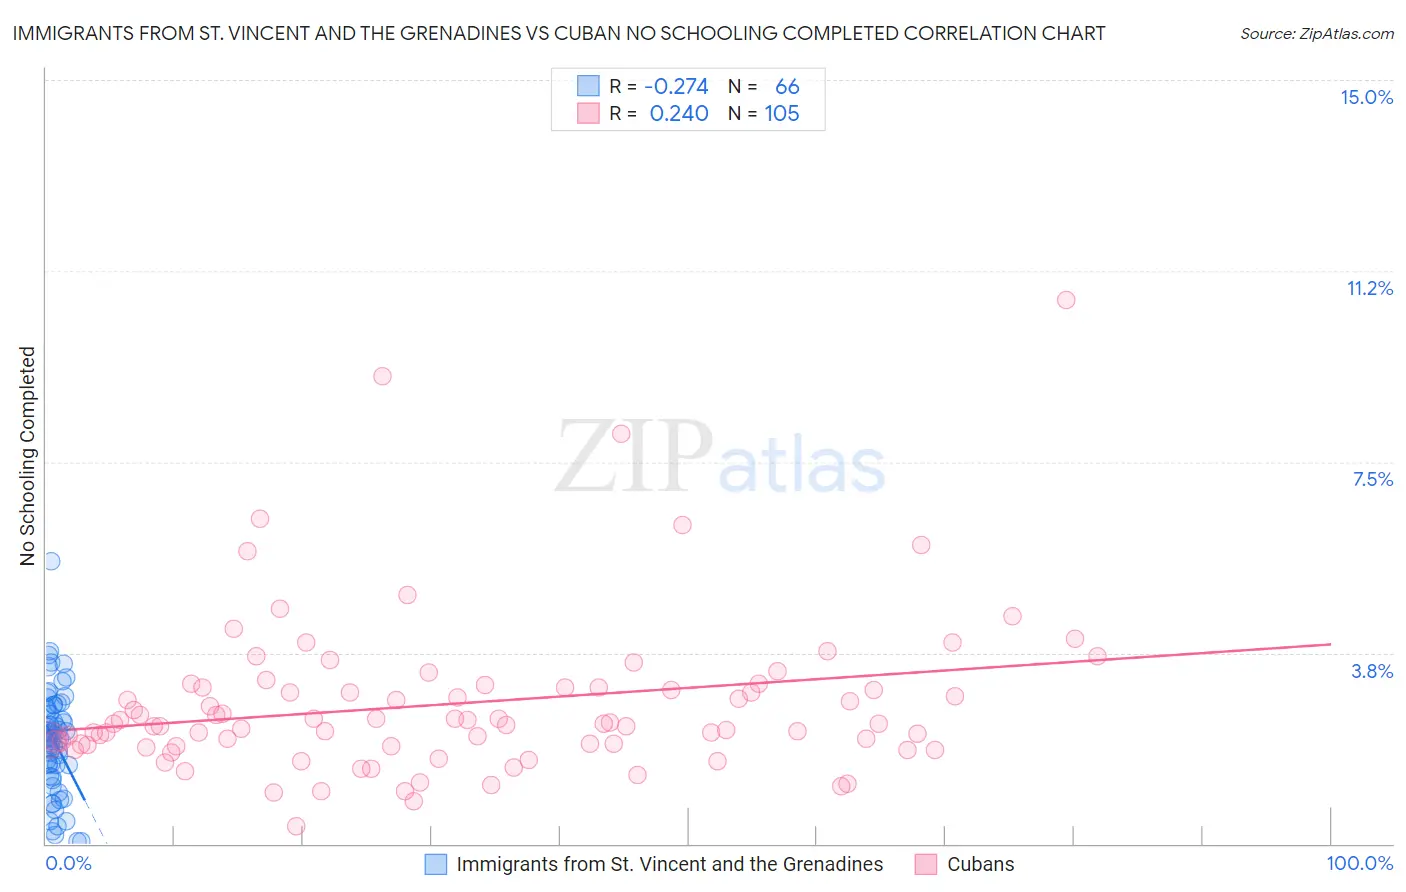
Immigrants from St. Vincent and the Grenadines vs Cuban No Schooling Completed Correlation Chart
The statistical analysis conducted on geographies consisting of 56,079,309 people shows a weak negative correlation between the proportion of Immigrants from St. Vincent and the Grenadines and percentage of population with no schooling in the United States with a correlation coefficient (R) of -0.274 and weighted average of 2.7%. Similarly, the statistical analysis conducted on geographies consisting of 444,053,579 people shows a weak positive correlation between the proportion of Cubans and percentage of population with no schooling in the United States with a correlation coefficient (R) of 0.240 and weighted average of 2.5%, a difference of 7.1%.
No Schooling Completed Correlation Summary
| Measurement | Immigrants from St. Vincent and the Grenadines | Cuban |
| Minimum | 0.050% | 0.33% |
| Maximum | 5.6% | 10.7% |
| Range | 5.5% | 10.4% |
| Mean | 2.0% | 2.8% |
| Median | 2.1% | 2.4% |
| Interquartile 25% (IQ1) | 1.3% | 1.9% |
| Interquartile 75% (IQ3) | 2.7% | 3.1% |
| Interquartile Range (IQR) | 1.3% | 1.1% |
| Standard Deviation (Sample) | 1.0% | 1.6% |
| Standard Deviation (Population) | 1.0% | 1.6% |
Demographics Similar to Immigrants from St. Vincent and the Grenadines and Cubans by No Schooling Completed
In terms of no schooling completed, the demographic groups most similar to Immigrants from St. Vincent and the Grenadines are Immigrants from Afghanistan (2.7%, a difference of 0.10%), Immigrants from Thailand (2.7%, a difference of 0.32%), Immigrants from Portugal (2.7%, a difference of 0.91%), Immigrants from Barbados (2.7%, a difference of 1.3%), and Immigrants from West Indies (2.7%, a difference of 1.4%). Similarly, the demographic groups most similar to Cubans are Immigrants from Peru (2.5%, a difference of 0.010%), Immigrants from Nigeria (2.5%, a difference of 0.090%), Immigrants from Bolivia (2.5%, a difference of 0.53%), Immigrants from Cameroon (2.5%, a difference of 1.3%), and Ghanaian (2.6%, a difference of 1.7%).
| Demographics | Rating | Rank | No Schooling Completed |
| Immigrants | Nigeria | 0.2 /100 | #269 | Tragic 2.5% |
| Immigrants | Peru | 0.2 /100 | #270 | Tragic 2.5% |
| Cubans | 0.2 /100 | #271 | Tragic 2.5% |
| Immigrants | Bolivia | 0.2 /100 | #272 | Tragic 2.5% |
| Immigrants | Cameroon | 0.1 /100 | #273 | Tragic 2.5% |
| Ghanaians | 0.1 /100 | #274 | Tragic 2.6% |
| Immigrants | China | 0.1 /100 | #275 | Tragic 2.6% |
| Immigrants | Western Africa | 0.1 /100 | #276 | Tragic 2.6% |
| Immigrants | Philippines | 0.1 /100 | #277 | Tragic 2.6% |
| Immigrants | Uzbekistan | 0.1 /100 | #278 | Tragic 2.6% |
| Barbadians | 0.1 /100 | #279 | Tragic 2.6% |
| Trinidadians and Tobagonians | 0.1 /100 | #280 | Tragic 2.6% |
| Afghans | 0.1 /100 | #281 | Tragic 2.6% |
| Immigrants | Ghana | 0.1 /100 | #282 | Tragic 2.6% |
| Immigrants | Trinidad and Tobago | 0.0 /100 | #283 | Tragic 2.6% |
| Immigrants | West Indies | 0.0 /100 | #284 | Tragic 2.7% |
| Immigrants | Barbados | 0.0 /100 | #285 | Tragic 2.7% |
| Immigrants | Portugal | 0.0 /100 | #286 | Tragic 2.7% |
| Immigrants | Afghanistan | 0.0 /100 | #287 | Tragic 2.7% |
| Immigrants | St. Vincent and the Grenadines | 0.0 /100 | #288 | Tragic 2.7% |
| Immigrants | Thailand | 0.0 /100 | #289 | Tragic 2.7% |