Celtic vs Cuban No Schooling Completed
COMPARE
Celtic
Cuban
No Schooling Completed
No Schooling Completed Comparison
Celtics
Cubans
1.6%
NO SCHOOLING COMPLETED
99.9/ 100
METRIC RATING
50th/ 347
METRIC RANK
2.5%
NO SCHOOLING COMPLETED
0.2/ 100
METRIC RATING
271st/ 347
METRIC RANK
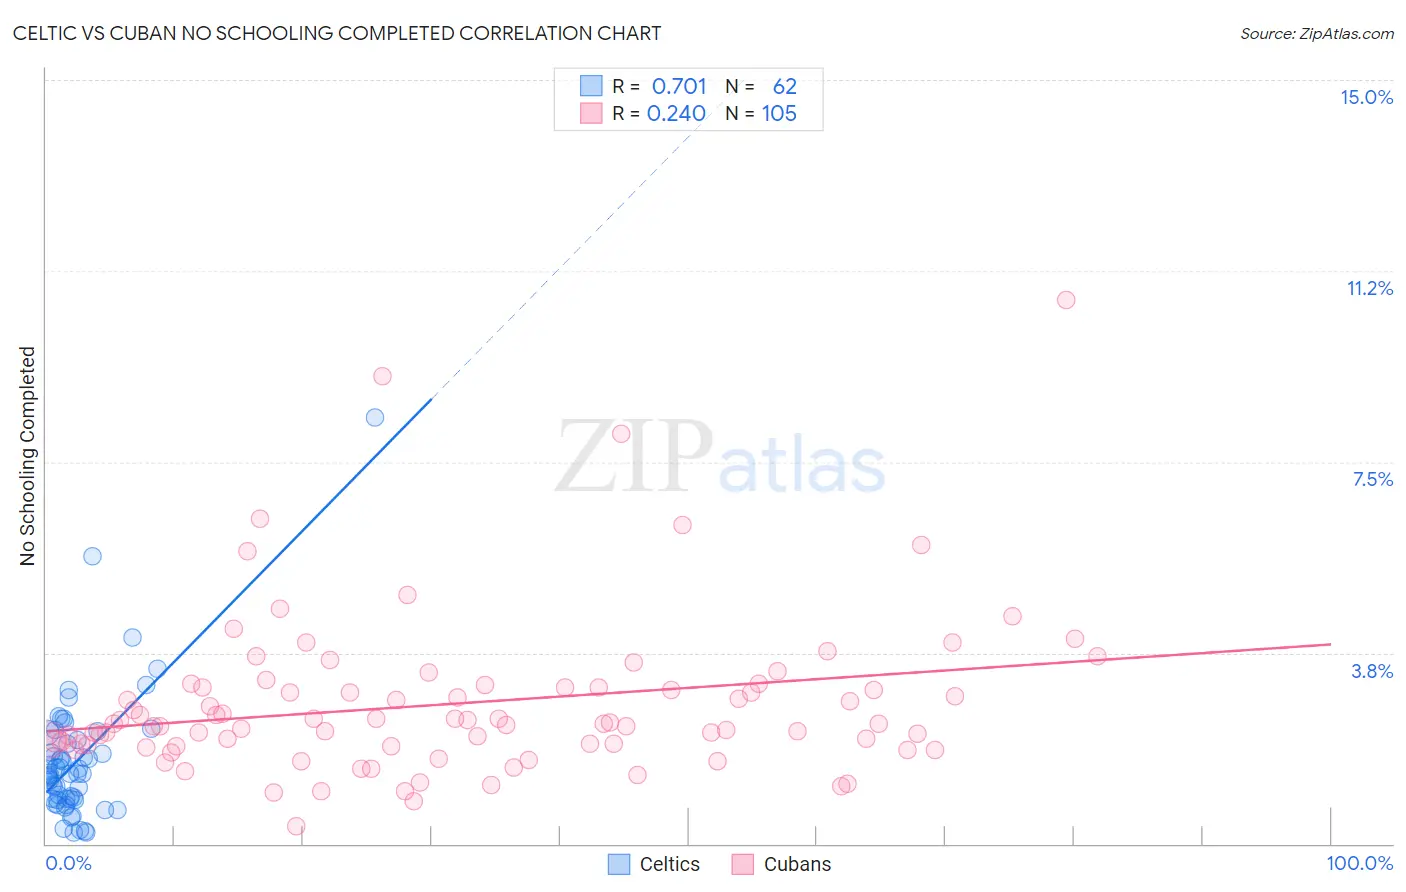
Celtic vs Cuban No Schooling Completed Correlation Chart
The statistical analysis conducted on geographies consisting of 167,819,688 people shows a strong positive correlation between the proportion of Celtics and percentage of population with no schooling in the United States with a correlation coefficient (R) of 0.701 and weighted average of 1.6%. Similarly, the statistical analysis conducted on geographies consisting of 444,053,579 people shows a weak positive correlation between the proportion of Cubans and percentage of population with no schooling in the United States with a correlation coefficient (R) of 0.240 and weighted average of 2.5%, a difference of 54.1%.
No Schooling Completed Correlation Summary
| Measurement | Celtic | Cuban |
| Minimum | 0.22% | 0.33% |
| Maximum | 8.4% | 10.7% |
| Range | 8.2% | 10.4% |
| Mean | 1.6% | 2.8% |
| Median | 1.4% | 2.4% |
| Interquartile 25% (IQ1) | 0.87% | 1.9% |
| Interquartile 75% (IQ3) | 2.0% | 3.1% |
| Interquartile Range (IQR) | 1.2% | 1.1% |
| Standard Deviation (Sample) | 1.3% | 1.6% |
| Standard Deviation (Population) | 1.3% | 1.6% |
Similar Demographics by No Schooling Completed
Demographics Similar to Celtics by No Schooling Completed
In terms of no schooling completed, the demographic groups most similar to Celtics are White/Caucasian (1.6%, a difference of 0.13%), Immigrants from Scotland (1.6%, a difference of 0.19%), Chippewa (1.6%, a difference of 0.20%), Immigrants from Canada (1.6%, a difference of 0.27%), and Creek (1.6%, a difference of 0.40%).
| Demographics | Rating | Rank | No Schooling Completed |
| Australians | 99.9 /100 | #43 | Exceptional 1.6% |
| Estonians | 99.9 /100 | #44 | Exceptional 1.6% |
| Czechoslovakians | 99.9 /100 | #45 | Exceptional 1.6% |
| Maltese | 99.9 /100 | #46 | Exceptional 1.6% |
| Ottawa | 99.9 /100 | #47 | Exceptional 1.6% |
| Immigrants | Scotland | 99.9 /100 | #48 | Exceptional 1.6% |
| Whites/Caucasians | 99.9 /100 | #49 | Exceptional 1.6% |
| Celtics | 99.9 /100 | #50 | Exceptional 1.6% |
| Chippewa | 99.8 /100 | #51 | Exceptional 1.6% |
| Immigrants | Canada | 99.8 /100 | #52 | Exceptional 1.6% |
| Creek | 99.8 /100 | #53 | Exceptional 1.6% |
| Crow | 99.8 /100 | #54 | Exceptional 1.6% |
| Greeks | 99.8 /100 | #55 | Exceptional 1.6% |
| Immigrants | North America | 99.8 /100 | #56 | Exceptional 1.6% |
| Austrians | 99.8 /100 | #57 | Exceptional 1.6% |
Demographics Similar to Cubans by No Schooling Completed
In terms of no schooling completed, the demographic groups most similar to Cubans are Immigrants from Peru (2.5%, a difference of 0.010%), Immigrants from Nigeria (2.5%, a difference of 0.090%), Immigrants from Bolivia (2.5%, a difference of 0.53%), Taiwanese (2.5%, a difference of 0.95%), and Yuman (2.5%, a difference of 1.2%).
| Demographics | Rating | Rank | No Schooling Completed |
| Indians (Asian) | 0.4 /100 | #264 | Tragic 2.5% |
| West Indians | 0.4 /100 | #265 | Tragic 2.5% |
| Fijians | 0.4 /100 | #266 | Tragic 2.5% |
| Yuman | 0.4 /100 | #267 | Tragic 2.5% |
| Taiwanese | 0.3 /100 | #268 | Tragic 2.5% |
| Immigrants | Nigeria | 0.2 /100 | #269 | Tragic 2.5% |
| Immigrants | Peru | 0.2 /100 | #270 | Tragic 2.5% |
| Cubans | 0.2 /100 | #271 | Tragic 2.5% |
| Immigrants | Bolivia | 0.2 /100 | #272 | Tragic 2.5% |
| Immigrants | Cameroon | 0.1 /100 | #273 | Tragic 2.5% |
| Ghanaians | 0.1 /100 | #274 | Tragic 2.6% |
| Immigrants | China | 0.1 /100 | #275 | Tragic 2.6% |
| Immigrants | Western Africa | 0.1 /100 | #276 | Tragic 2.6% |
| Immigrants | Philippines | 0.1 /100 | #277 | Tragic 2.6% |
| Immigrants | Uzbekistan | 0.1 /100 | #278 | Tragic 2.6% |