Thai vs German Russian Doctorate Degree
COMPARE
Thai
German Russian
Doctorate Degree
Doctorate Degree Comparison
Thais
German Russians
2.8%
DOCTORATE DEGREE
100.0/ 100
METRIC RATING
21st/ 347
METRIC RANK
1.8%
DOCTORATE DEGREE
27.1/ 100
METRIC RATING
193rd/ 347
METRIC RANK
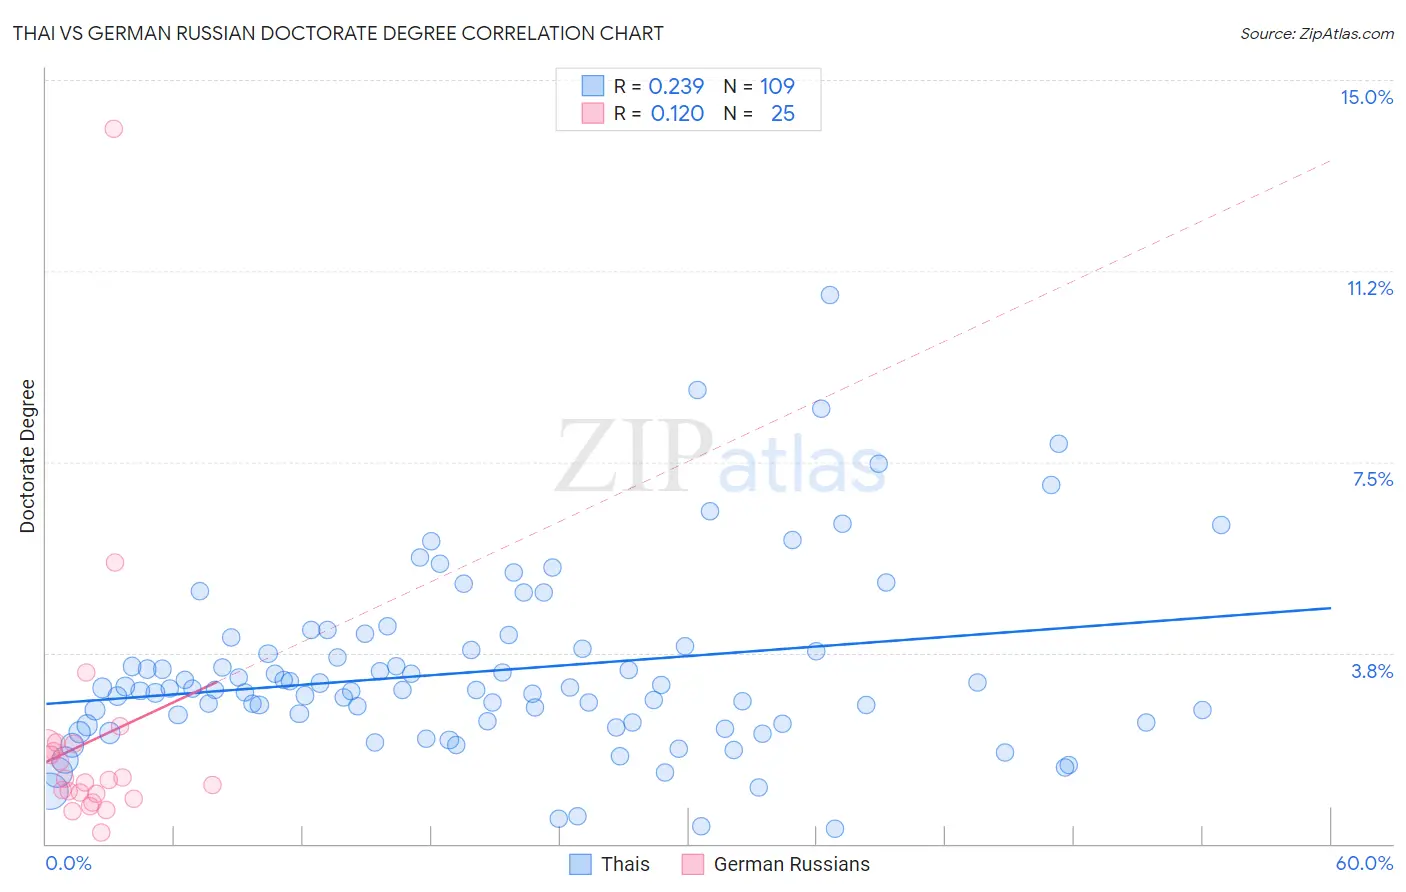
Thai vs German Russian Doctorate Degree Correlation Chart
The statistical analysis conducted on geographies consisting of 470,013,150 people shows a weak positive correlation between the proportion of Thais and percentage of population with at least doctorate degree education in the United States with a correlation coefficient (R) of 0.239 and weighted average of 2.8%. Similarly, the statistical analysis conducted on geographies consisting of 96,106,122 people shows a poor positive correlation between the proportion of German Russians and percentage of population with at least doctorate degree education in the United States with a correlation coefficient (R) of 0.120 and weighted average of 1.8%, a difference of 56.0%.
Doctorate Degree Correlation Summary
| Measurement | Thai | German Russian |
| Minimum | 0.30% | 0.22% |
| Maximum | 10.8% | 14.0% |
| Range | 10.5% | 13.8% |
| Mean | 3.4% | 2.0% |
| Median | 3.0% | 1.3% |
| Interquartile 25% (IQ1) | 2.4% | 0.92% |
| Interquartile 75% (IQ3) | 3.8% | 1.9% |
| Interquartile Range (IQR) | 1.5% | 1.0% |
| Standard Deviation (Sample) | 1.8% | 2.7% |
| Standard Deviation (Population) | 1.8% | 2.7% |
Similar Demographics by Doctorate Degree
Demographics Similar to Thais by Doctorate Degree
In terms of doctorate degree, the demographic groups most similar to Thais are Mongolian (2.8%, a difference of 0.20%), Immigrants from Denmark (2.8%, a difference of 0.33%), Immigrants from Hong Kong (2.8%, a difference of 0.35%), Immigrants from Japan (2.8%, a difference of 0.70%), and Immigrants from Sri Lanka (2.8%, a difference of 1.1%).
| Demographics | Rating | Rank | Doctorate Degree |
| Immigrants | France | 100.0 /100 | #14 | Exceptional 2.9% |
| Immigrants | India | 100.0 /100 | #15 | Exceptional 2.8% |
| Eastern Europeans | 100.0 /100 | #16 | Exceptional 2.8% |
| Immigrants | Australia | 100.0 /100 | #17 | Exceptional 2.8% |
| Immigrants | Sri Lanka | 100.0 /100 | #18 | Exceptional 2.8% |
| Immigrants | Japan | 100.0 /100 | #19 | Exceptional 2.8% |
| Immigrants | Hong Kong | 100.0 /100 | #20 | Exceptional 2.8% |
| Thais | 100.0 /100 | #21 | Exceptional 2.8% |
| Mongolians | 100.0 /100 | #22 | Exceptional 2.8% |
| Immigrants | Denmark | 100.0 /100 | #23 | Exceptional 2.8% |
| Israelis | 100.0 /100 | #24 | Exceptional 2.7% |
| Immigrants | Saudi Arabia | 100.0 /100 | #25 | Exceptional 2.7% |
| Turks | 100.0 /100 | #26 | Exceptional 2.7% |
| Immigrants | Turkey | 100.0 /100 | #27 | Exceptional 2.6% |
| Burmese | 100.0 /100 | #28 | Exceptional 2.6% |
Demographics Similar to German Russians by Doctorate Degree
In terms of doctorate degree, the demographic groups most similar to German Russians are Dutch (1.8%, a difference of 0.070%), Uruguayan (1.8%, a difference of 0.17%), Immigrants from Somalia (1.8%, a difference of 0.33%), Subsaharan African (1.8%, a difference of 0.40%), and Chinese (1.8%, a difference of 0.40%).
| Demographics | Rating | Rank | Doctorate Degree |
| Peruvians | 34.4 /100 | #186 | Fair 1.8% |
| Czechoslovakians | 33.0 /100 | #187 | Fair 1.8% |
| Germans | 30.5 /100 | #188 | Fair 1.8% |
| French Canadians | 30.2 /100 | #189 | Fair 1.8% |
| Immigrants | Costa Rica | 30.2 /100 | #190 | Fair 1.8% |
| South Americans | 29.5 /100 | #191 | Fair 1.8% |
| Dutch | 27.4 /100 | #192 | Fair 1.8% |
| German Russians | 27.1 /100 | #193 | Fair 1.8% |
| Uruguayans | 26.2 /100 | #194 | Fair 1.8% |
| Immigrants | Somalia | 25.4 /100 | #195 | Fair 1.8% |
| Sub-Saharan Africans | 25.1 /100 | #196 | Fair 1.8% |
| Chinese | 25.1 /100 | #197 | Fair 1.8% |
| Immigrants | Ghana | 24.6 /100 | #198 | Fair 1.8% |
| Immigrants | South America | 23.3 /100 | #199 | Fair 1.8% |
| Whites/Caucasians | 22.8 /100 | #200 | Fair 1.8% |