Thai vs Trinidadian and Tobagonian Doctorate Degree
COMPARE
Thai
Trinidadian and Tobagonian
Doctorate Degree
Doctorate Degree Comparison
Thais
Trinidadians and Tobagonians
2.8%
DOCTORATE DEGREE
100.0/ 100
METRIC RATING
21st/ 347
METRIC RANK
1.5%
DOCTORATE DEGREE
1.0/ 100
METRIC RATING
255th/ 347
METRIC RANK
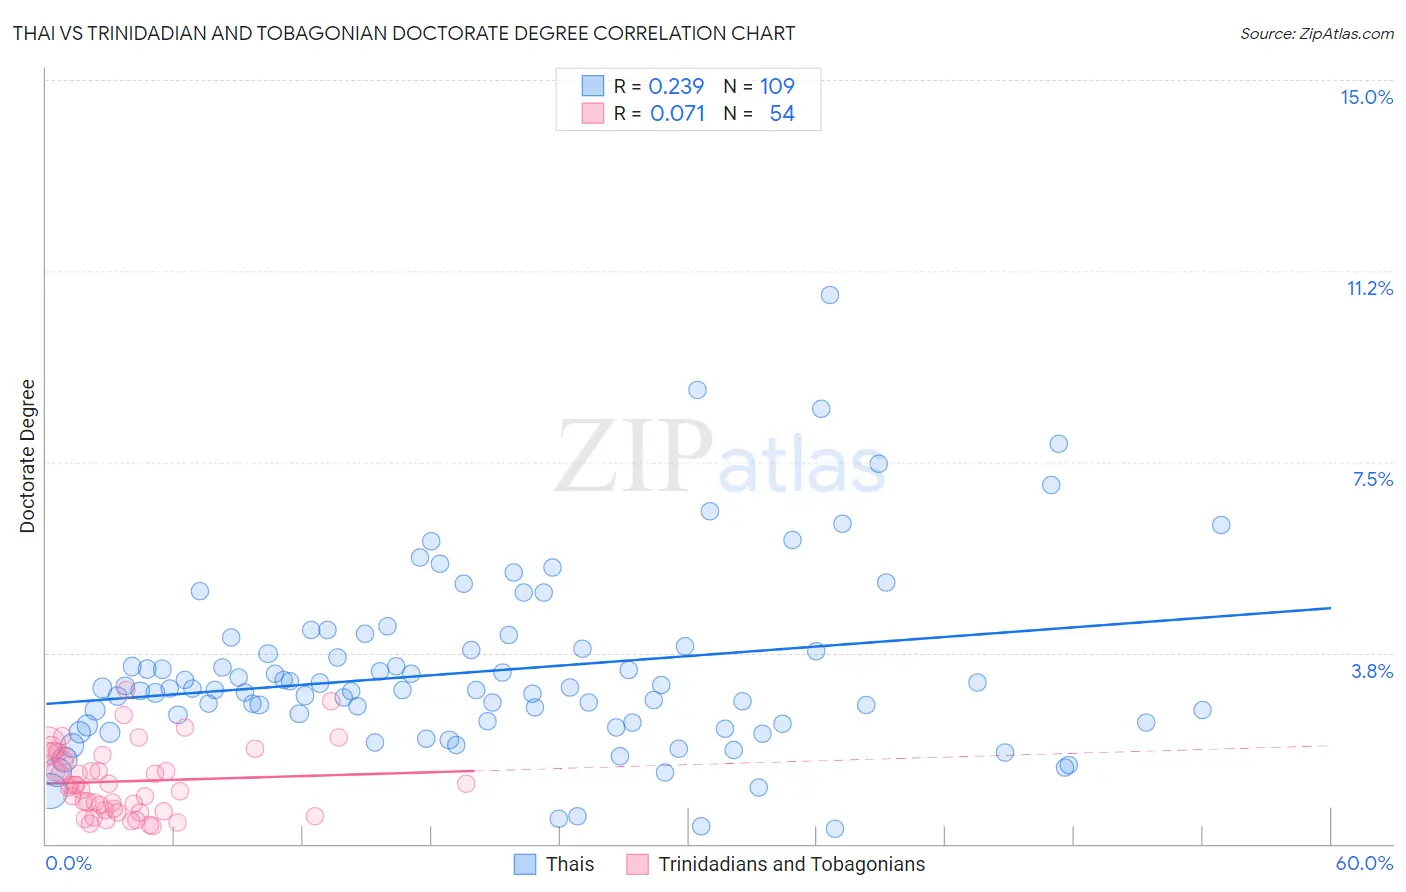
Thai vs Trinidadian and Tobagonian Doctorate Degree Correlation Chart
The statistical analysis conducted on geographies consisting of 470,013,150 people shows a weak positive correlation between the proportion of Thais and percentage of population with at least doctorate degree education in the United States with a correlation coefficient (R) of 0.239 and weighted average of 2.8%. Similarly, the statistical analysis conducted on geographies consisting of 218,914,311 people shows a slight positive correlation between the proportion of Trinidadians and Tobagonians and percentage of population with at least doctorate degree education in the United States with a correlation coefficient (R) of 0.071 and weighted average of 1.5%, a difference of 80.9%.
Doctorate Degree Correlation Summary
| Measurement | Thai | Trinidadian and Tobagonian |
| Minimum | 0.30% | 0.35% |
| Maximum | 10.8% | 3.0% |
| Range | 10.5% | 2.7% |
| Mean | 3.4% | 1.2% |
| Median | 3.0% | 1.2% |
| Interquartile 25% (IQ1) | 2.4% | 0.65% |
| Interquartile 75% (IQ3) | 3.8% | 1.7% |
| Interquartile Range (IQR) | 1.5% | 1.1% |
| Standard Deviation (Sample) | 1.8% | 0.66% |
| Standard Deviation (Population) | 1.8% | 0.65% |
Similar Demographics by Doctorate Degree
Demographics Similar to Thais by Doctorate Degree
In terms of doctorate degree, the demographic groups most similar to Thais are Mongolian (2.8%, a difference of 0.20%), Immigrants from Denmark (2.8%, a difference of 0.33%), Immigrants from Hong Kong (2.8%, a difference of 0.35%), Immigrants from Japan (2.8%, a difference of 0.70%), and Immigrants from Sri Lanka (2.8%, a difference of 1.1%).
| Demographics | Rating | Rank | Doctorate Degree |
| Immigrants | France | 100.0 /100 | #14 | Exceptional 2.9% |
| Immigrants | India | 100.0 /100 | #15 | Exceptional 2.8% |
| Eastern Europeans | 100.0 /100 | #16 | Exceptional 2.8% |
| Immigrants | Australia | 100.0 /100 | #17 | Exceptional 2.8% |
| Immigrants | Sri Lanka | 100.0 /100 | #18 | Exceptional 2.8% |
| Immigrants | Japan | 100.0 /100 | #19 | Exceptional 2.8% |
| Immigrants | Hong Kong | 100.0 /100 | #20 | Exceptional 2.8% |
| Thais | 100.0 /100 | #21 | Exceptional 2.8% |
| Mongolians | 100.0 /100 | #22 | Exceptional 2.8% |
| Immigrants | Denmark | 100.0 /100 | #23 | Exceptional 2.8% |
| Israelis | 100.0 /100 | #24 | Exceptional 2.7% |
| Immigrants | Saudi Arabia | 100.0 /100 | #25 | Exceptional 2.7% |
| Turks | 100.0 /100 | #26 | Exceptional 2.7% |
| Immigrants | Turkey | 100.0 /100 | #27 | Exceptional 2.6% |
| Burmese | 100.0 /100 | #28 | Exceptional 2.6% |
Demographics Similar to Trinidadians and Tobagonians by Doctorate Degree
In terms of doctorate degree, the demographic groups most similar to Trinidadians and Tobagonians are Immigrants from Cambodia (1.5%, a difference of 0.010%), Central American Indian (1.5%, a difference of 0.050%), American (1.5%, a difference of 0.13%), Chippewa (1.5%, a difference of 0.27%), and Yuman (1.5%, a difference of 0.28%).
| Demographics | Rating | Rank | Doctorate Degree |
| Africans | 1.8 /100 | #248 | Tragic 1.6% |
| Potawatomi | 1.6 /100 | #249 | Tragic 1.6% |
| Immigrants | Fiji | 1.6 /100 | #250 | Tragic 1.6% |
| Apache | 1.3 /100 | #251 | Tragic 1.5% |
| Yuman | 1.1 /100 | #252 | Tragic 1.5% |
| Americans | 1.0 /100 | #253 | Tragic 1.5% |
| Immigrants | Cambodia | 1.0 /100 | #254 | Tragic 1.5% |
| Trinidadians and Tobagonians | 1.0 /100 | #255 | Tragic 1.5% |
| Central American Indians | 1.0 /100 | #256 | Tragic 1.5% |
| Chippewa | 0.9 /100 | #257 | Tragic 1.5% |
| Immigrants | West Indies | 0.9 /100 | #258 | Tragic 1.5% |
| Liberians | 0.9 /100 | #259 | Tragic 1.5% |
| Japanese | 0.9 /100 | #260 | Tragic 1.5% |
| Immigrants | Portugal | 0.8 /100 | #261 | Tragic 1.5% |
| Chickasaw | 0.7 /100 | #262 | Tragic 1.5% |