Thai vs Palestinian Doctorate Degree
COMPARE
Thai
Palestinian
Doctorate Degree
Doctorate Degree Comparison
Thais
Palestinians
2.8%
DOCTORATE DEGREE
100.0/ 100
METRIC RATING
21st/ 347
METRIC RANK
2.0%
DOCTORATE DEGREE
92.0/ 100
METRIC RATING
127th/ 347
METRIC RANK
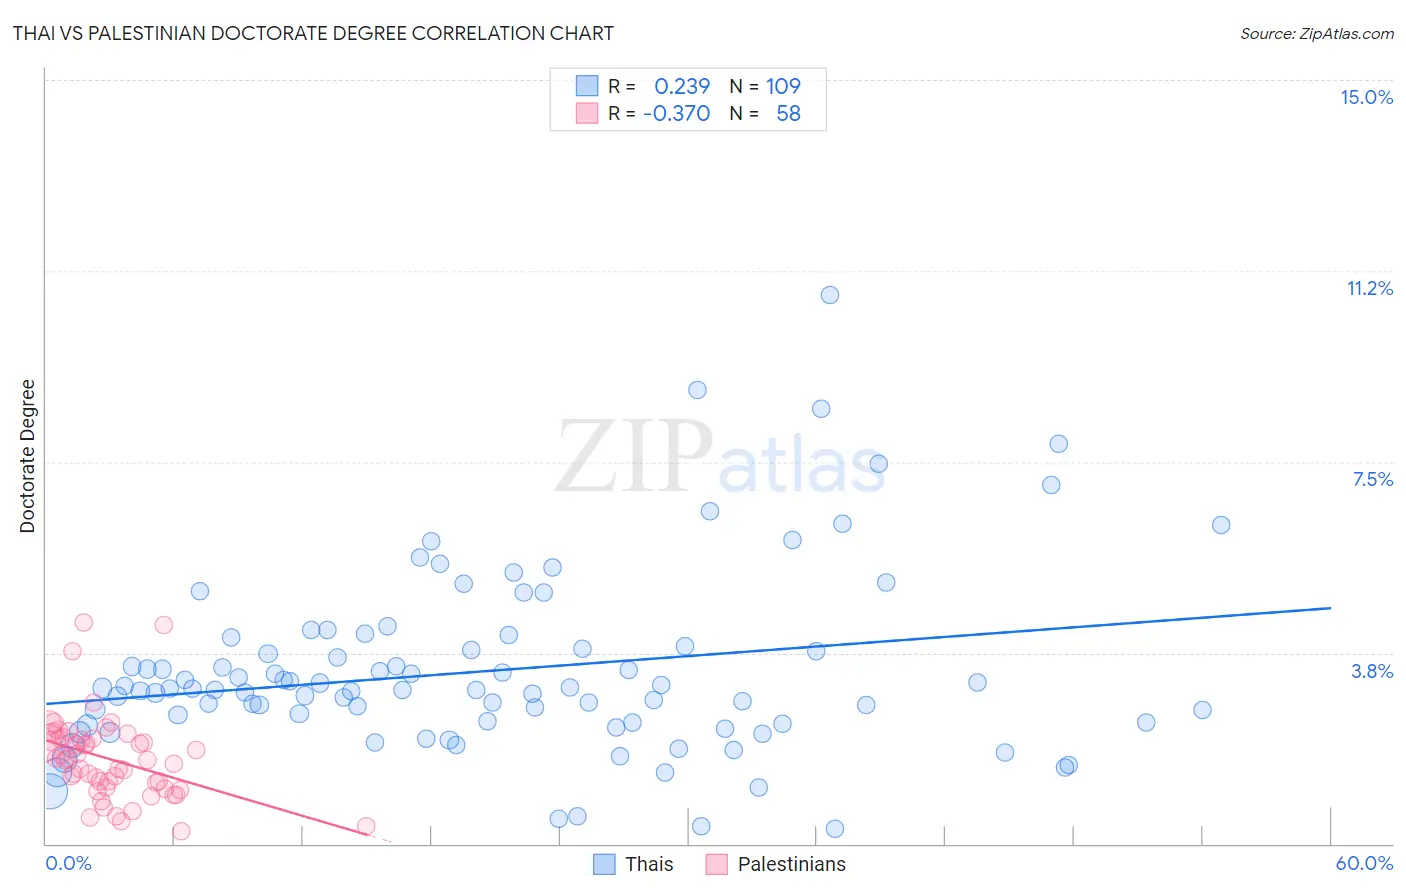
Thai vs Palestinian Doctorate Degree Correlation Chart
The statistical analysis conducted on geographies consisting of 470,013,150 people shows a weak positive correlation between the proportion of Thais and percentage of population with at least doctorate degree education in the United States with a correlation coefficient (R) of 0.239 and weighted average of 2.8%. Similarly, the statistical analysis conducted on geographies consisting of 215,891,149 people shows a mild negative correlation between the proportion of Palestinians and percentage of population with at least doctorate degree education in the United States with a correlation coefficient (R) of -0.370 and weighted average of 2.0%, a difference of 38.0%.
Doctorate Degree Correlation Summary
| Measurement | Thai | Palestinian |
| Minimum | 0.30% | 0.24% |
| Maximum | 10.8% | 4.4% |
| Range | 10.5% | 4.1% |
| Mean | 3.4% | 1.7% |
| Median | 3.0% | 1.6% |
| Interquartile 25% (IQ1) | 2.4% | 1.1% |
| Interquartile 75% (IQ3) | 3.8% | 2.1% |
| Interquartile Range (IQR) | 1.5% | 0.95% |
| Standard Deviation (Sample) | 1.8% | 0.83% |
| Standard Deviation (Population) | 1.8% | 0.82% |
Similar Demographics by Doctorate Degree
Demographics Similar to Thais by Doctorate Degree
In terms of doctorate degree, the demographic groups most similar to Thais are Mongolian (2.8%, a difference of 0.20%), Immigrants from Denmark (2.8%, a difference of 0.33%), Immigrants from Hong Kong (2.8%, a difference of 0.35%), Immigrants from Japan (2.8%, a difference of 0.70%), and Immigrants from Sri Lanka (2.8%, a difference of 1.1%).
| Demographics | Rating | Rank | Doctorate Degree |
| Immigrants | France | 100.0 /100 | #14 | Exceptional 2.9% |
| Immigrants | India | 100.0 /100 | #15 | Exceptional 2.8% |
| Eastern Europeans | 100.0 /100 | #16 | Exceptional 2.8% |
| Immigrants | Australia | 100.0 /100 | #17 | Exceptional 2.8% |
| Immigrants | Sri Lanka | 100.0 /100 | #18 | Exceptional 2.8% |
| Immigrants | Japan | 100.0 /100 | #19 | Exceptional 2.8% |
| Immigrants | Hong Kong | 100.0 /100 | #20 | Exceptional 2.8% |
| Thais | 100.0 /100 | #21 | Exceptional 2.8% |
| Mongolians | 100.0 /100 | #22 | Exceptional 2.8% |
| Immigrants | Denmark | 100.0 /100 | #23 | Exceptional 2.8% |
| Israelis | 100.0 /100 | #24 | Exceptional 2.7% |
| Immigrants | Saudi Arabia | 100.0 /100 | #25 | Exceptional 2.7% |
| Turks | 100.0 /100 | #26 | Exceptional 2.7% |
| Immigrants | Turkey | 100.0 /100 | #27 | Exceptional 2.6% |
| Burmese | 100.0 /100 | #28 | Exceptional 2.6% |
Demographics Similar to Palestinians by Doctorate Degree
In terms of doctorate degree, the demographic groups most similar to Palestinians are Jordanian (2.0%, a difference of 0.040%), Immigrants from Zaire (2.0%, a difference of 0.42%), Moroccan (2.0%, a difference of 0.45%), Ute (2.0%, a difference of 0.56%), and Canadian (2.0%, a difference of 0.63%).
| Demographics | Rating | Rank | Doctorate Degree |
| Immigrants | Morocco | 95.5 /100 | #120 | Exceptional 2.0% |
| Immigrants | Jordan | 94.8 /100 | #121 | Exceptional 2.0% |
| Immigrants | Southern Europe | 94.7 /100 | #122 | Exceptional 2.0% |
| Croatians | 94.0 /100 | #123 | Exceptional 2.0% |
| Ute | 93.2 /100 | #124 | Exceptional 2.0% |
| Moroccans | 93.0 /100 | #125 | Exceptional 2.0% |
| Jordanians | 92.1 /100 | #126 | Exceptional 2.0% |
| Palestinians | 92.0 /100 | #127 | Exceptional 2.0% |
| Immigrants | Zaire | 91.1 /100 | #128 | Exceptional 2.0% |
| Canadians | 90.6 /100 | #129 | Exceptional 2.0% |
| Immigrants | Ukraine | 90.5 /100 | #130 | Exceptional 2.0% |
| Immigrants | Sierra Leone | 90.2 /100 | #131 | Exceptional 2.0% |
| Scottish | 89.4 /100 | #132 | Excellent 2.0% |
| Immigrants | Uzbekistan | 89.3 /100 | #133 | Excellent 2.0% |
| Immigrants | Cameroon | 88.9 /100 | #134 | Excellent 2.0% |