Spanish vs Immigrants from Belarus Professional Degree
COMPARE
Spanish
Immigrants from Belarus
Professional Degree
Professional Degree Comparison
Spanish
Immigrants from Belarus
4.2%
PROFESSIONAL DEGREE
23.0/ 100
METRIC RATING
196th/ 347
METRIC RANK
5.5%
PROFESSIONAL DEGREE
99.9/ 100
METRIC RATING
62nd/ 347
METRIC RANK
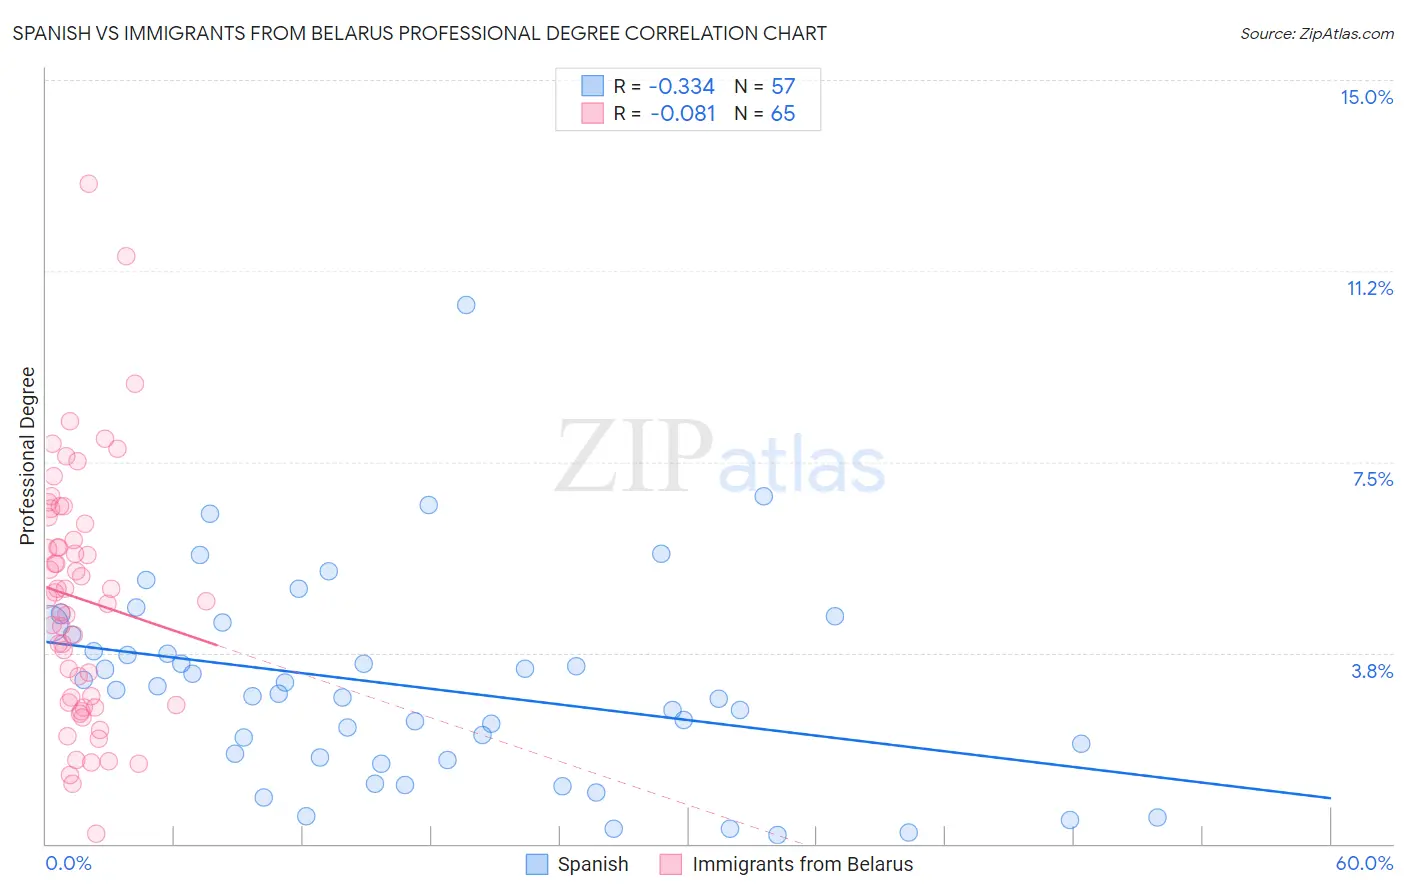
Spanish vs Immigrants from Belarus Professional Degree Correlation Chart
The statistical analysis conducted on geographies consisting of 420,419,286 people shows a mild negative correlation between the proportion of Spanish and percentage of population with at least professional degree education in the United States with a correlation coefficient (R) of -0.334 and weighted average of 4.2%. Similarly, the statistical analysis conducted on geographies consisting of 150,142,268 people shows a slight negative correlation between the proportion of Immigrants from Belarus and percentage of population with at least professional degree education in the United States with a correlation coefficient (R) of -0.081 and weighted average of 5.5%, a difference of 31.3%.
Professional Degree Correlation Summary
| Measurement | Spanish | Immigrants from Belarus |
| Minimum | 0.17% | 0.19% |
| Maximum | 10.6% | 13.0% |
| Range | 10.4% | 12.8% |
| Mean | 3.1% | 4.8% |
| Median | 2.9% | 4.8% |
| Interquartile 25% (IQ1) | 1.7% | 2.8% |
| Interquartile 75% (IQ3) | 4.2% | 6.3% |
| Interquartile Range (IQR) | 2.5% | 3.6% |
| Standard Deviation (Sample) | 2.0% | 2.4% |
| Standard Deviation (Population) | 2.0% | 2.4% |
Similar Demographics by Professional Degree
Demographics Similar to Spanish by Professional Degree
In terms of professional degree, the demographic groups most similar to Spanish are Czechoslovakian (4.2%, a difference of 0.14%), Immigrants from Middle Africa (4.2%, a difference of 0.19%), Nigerian (4.2%, a difference of 0.33%), Norwegian (4.2%, a difference of 0.56%), and Scandinavian (4.2%, a difference of 0.57%).
| Demographics | Rating | Rank | Professional Degree |
| Slovaks | 30.7 /100 | #189 | Fair 4.3% |
| Immigrants | Poland | 29.2 /100 | #190 | Fair 4.3% |
| Sri Lankans | 29.0 /100 | #191 | Fair 4.3% |
| Ghanaians | 27.3 /100 | #192 | Fair 4.3% |
| French | 27.1 /100 | #193 | Fair 4.2% |
| Scandinavians | 25.8 /100 | #194 | Fair 4.2% |
| Nigerians | 24.6 /100 | #195 | Fair 4.2% |
| Spanish | 23.0 /100 | #196 | Fair 4.2% |
| Czechoslovakians | 22.4 /100 | #197 | Fair 4.2% |
| Immigrants | Middle Africa | 22.1 /100 | #198 | Fair 4.2% |
| Norwegians | 20.5 /100 | #199 | Fair 4.2% |
| Immigrants | North Macedonia | 20.2 /100 | #200 | Fair 4.2% |
| Finns | 18.7 /100 | #201 | Poor 4.2% |
| Immigrants | Iraq | 17.1 /100 | #202 | Poor 4.2% |
| Panamanians | 15.9 /100 | #203 | Poor 4.1% |
Demographics Similar to Immigrants from Belarus by Professional Degree
In terms of professional degree, the demographic groups most similar to Immigrants from Belarus are Asian (5.5%, a difference of 0.43%), Immigrants from Asia (5.5%, a difference of 0.49%), Immigrants from Bolivia (5.5%, a difference of 0.56%), Immigrants from Lithuania (5.6%, a difference of 0.76%), and Immigrants from Kazakhstan (5.5%, a difference of 0.79%).
| Demographics | Rating | Rank | Professional Degree |
| Immigrants | Western Europe | 100.0 /100 | #55 | Exceptional 5.7% |
| Immigrants | Malaysia | 100.0 /100 | #56 | Exceptional 5.7% |
| South Africans | 100.0 /100 | #57 | Exceptional 5.7% |
| Bulgarians | 100.0 /100 | #58 | Exceptional 5.7% |
| Immigrants | Europe | 100.0 /100 | #59 | Exceptional 5.6% |
| Bolivians | 99.9 /100 | #60 | Exceptional 5.6% |
| Immigrants | Lithuania | 99.9 /100 | #61 | Exceptional 5.6% |
| Immigrants | Belarus | 99.9 /100 | #62 | Exceptional 5.5% |
| Asians | 99.9 /100 | #63 | Exceptional 5.5% |
| Immigrants | Asia | 99.9 /100 | #64 | Exceptional 5.5% |
| Immigrants | Bolivia | 99.9 /100 | #65 | Exceptional 5.5% |
| Immigrants | Kazakhstan | 99.9 /100 | #66 | Exceptional 5.5% |
| Immigrants | Bulgaria | 99.9 /100 | #67 | Exceptional 5.5% |
| Immigrants | Lebanon | 99.9 /100 | #68 | Exceptional 5.5% |
| Immigrants | Hungary | 99.9 /100 | #69 | Exceptional 5.5% |