Spanish vs Immigrants from Belarus Single Father Households
COMPARE
Spanish
Immigrants from Belarus
Single Father Households
Single Father Households Comparison
Spanish
Immigrants from Belarus
2.5%
SINGLE FATHER HOUSEHOLDS
1.1/ 100
METRIC RATING
258th/ 347
METRIC RANK
1.9%
SINGLE FATHER HOUSEHOLDS
100.0/ 100
METRIC RATING
11th/ 347
METRIC RANK
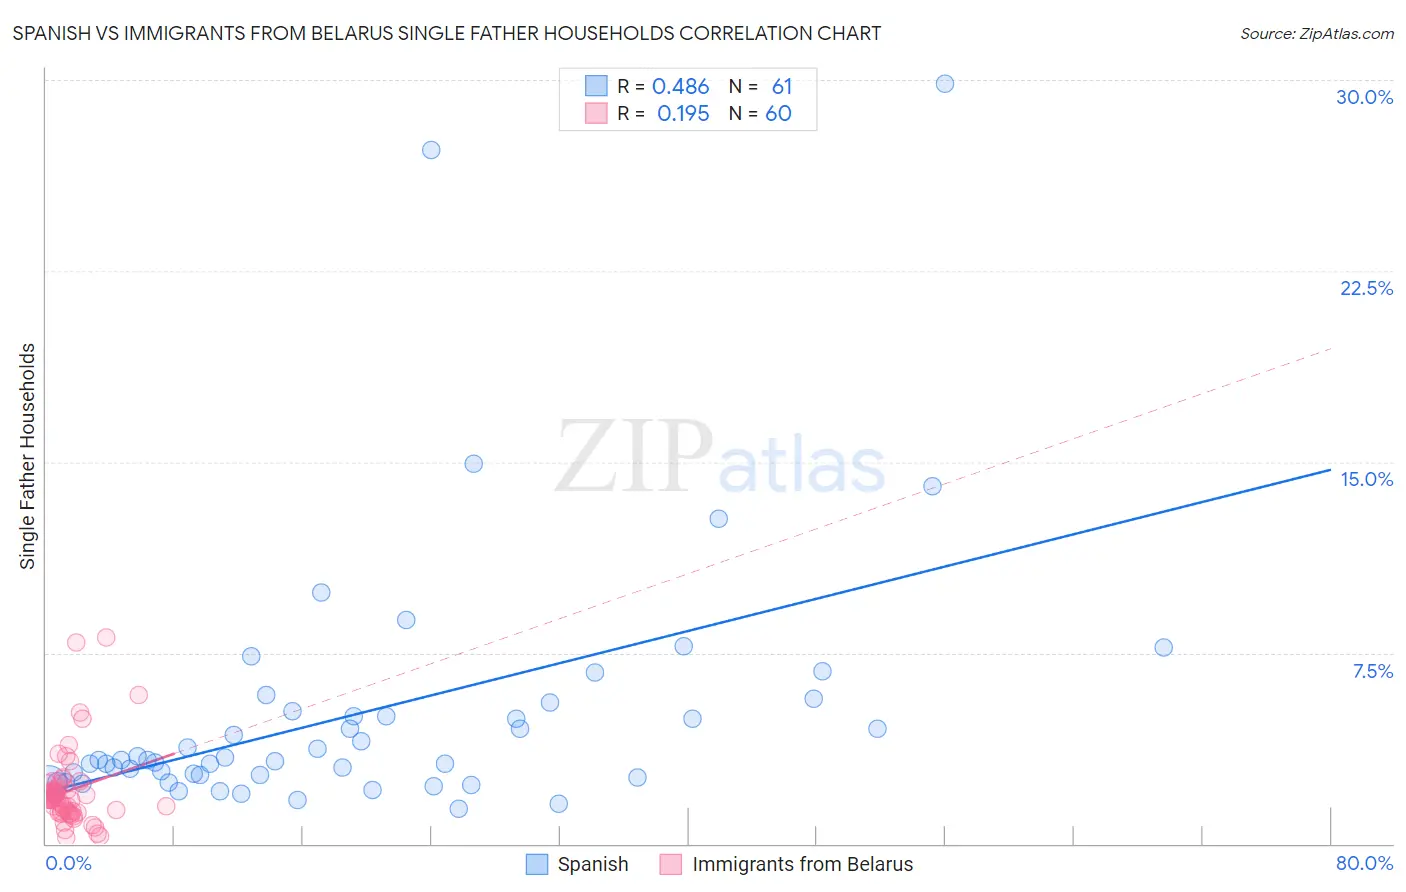
Spanish vs Immigrants from Belarus Single Father Households Correlation Chart
The statistical analysis conducted on geographies consisting of 418,035,178 people shows a moderate positive correlation between the proportion of Spanish and percentage of single father households in the United States with a correlation coefficient (R) of 0.486 and weighted average of 2.5%. Similarly, the statistical analysis conducted on geographies consisting of 149,894,019 people shows a poor positive correlation between the proportion of Immigrants from Belarus and percentage of single father households in the United States with a correlation coefficient (R) of 0.195 and weighted average of 1.9%, a difference of 36.1%.
Single Father Households Correlation Summary
| Measurement | Spanish | Immigrants from Belarus |
| Minimum | 1.4% | 0.25% |
| Maximum | 29.9% | 8.1% |
| Range | 28.5% | 7.9% |
| Mean | 5.2% | 2.1% |
| Median | 3.3% | 1.8% |
| Interquartile 25% (IQ1) | 2.6% | 1.2% |
| Interquartile 75% (IQ3) | 5.4% | 2.3% |
| Interquartile Range (IQR) | 2.7% | 1.0% |
| Standard Deviation (Sample) | 5.2% | 1.5% |
| Standard Deviation (Population) | 5.2% | 1.5% |
Similar Demographics by Single Father Households
Demographics Similar to Spanish by Single Father Households
In terms of single father households, the demographic groups most similar to Spanish are Immigrants from Congo (2.5%, a difference of 0.090%), Comanche (2.5%, a difference of 0.16%), Immigrants from Caribbean (2.5%, a difference of 0.24%), Potawatomi (2.5%, a difference of 0.37%), and Immigrants from Belize (2.5%, a difference of 0.40%).
| Demographics | Rating | Rank | Single Father Households |
| Liberians | 2.0 /100 | #251 | Tragic 2.5% |
| Immigrants | Eritrea | 2.0 /100 | #252 | Tragic 2.5% |
| Immigrants | Somalia | 1.9 /100 | #253 | Tragic 2.5% |
| Immigrants | Thailand | 1.8 /100 | #254 | Tragic 2.5% |
| Tongans | 1.5 /100 | #255 | Tragic 2.5% |
| Potawatomi | 1.4 /100 | #256 | Tragic 2.5% |
| Immigrants | Congo | 1.2 /100 | #257 | Tragic 2.5% |
| Spanish | 1.1 /100 | #258 | Tragic 2.5% |
| Comanche | 1.0 /100 | #259 | Tragic 2.5% |
| Immigrants | Caribbean | 1.0 /100 | #260 | Tragic 2.5% |
| Immigrants | Belize | 0.9 /100 | #261 | Tragic 2.5% |
| Immigrants | Liberia | 0.8 /100 | #262 | Tragic 2.5% |
| Dominicans | 0.8 /100 | #263 | Tragic 2.5% |
| Indonesians | 0.5 /100 | #264 | Tragic 2.6% |
| Immigrants | Micronesia | 0.5 /100 | #265 | Tragic 2.6% |
Demographics Similar to Immigrants from Belarus by Single Father Households
In terms of single father households, the demographic groups most similar to Immigrants from Belarus are Okinawan (1.9%, a difference of 0.32%), Immigrants from Greece (1.9%, a difference of 0.44%), Immigrants from Singapore (1.9%, a difference of 0.47%), Immigrants from China (1.8%, a difference of 0.68%), and Immigrants from Ireland (1.8%, a difference of 0.82%).
| Demographics | Rating | Rank | Single Father Households |
| Immigrants | Uzbekistan | 100.0 /100 | #4 | Exceptional 1.8% |
| Immigrants | Hong Kong | 100.0 /100 | #5 | Exceptional 1.8% |
| Immigrants | Taiwan | 100.0 /100 | #6 | Exceptional 1.8% |
| Cypriots | 100.0 /100 | #7 | Exceptional 1.8% |
| Immigrants | Ireland | 100.0 /100 | #8 | Exceptional 1.8% |
| Immigrants | China | 100.0 /100 | #9 | Exceptional 1.8% |
| Okinawans | 100.0 /100 | #10 | Exceptional 1.9% |
| Immigrants | Belarus | 100.0 /100 | #11 | Exceptional 1.9% |
| Immigrants | Greece | 100.0 /100 | #12 | Exceptional 1.9% |
| Immigrants | Singapore | 100.0 /100 | #13 | Exceptional 1.9% |
| Immigrants | Lithuania | 100.0 /100 | #14 | Exceptional 1.9% |
| Immigrants | Eastern Asia | 100.0 /100 | #15 | Exceptional 1.9% |
| Immigrants | Iran | 100.0 /100 | #16 | Exceptional 1.9% |
| Immigrants | India | 100.0 /100 | #17 | Exceptional 1.9% |
| Indians (Asian) | 100.0 /100 | #18 | Exceptional 1.9% |