Spanish vs Immigrants from Belarus Disability Age 35 to 64
COMPARE
Spanish
Immigrants from Belarus
Disability Age 35 to 64
Disability Age 35 to 64 Comparison
Spanish
Immigrants from Belarus
12.7%
DISABILITY AGE 35 TO 64
0.2/ 100
METRIC RATING
269th/ 347
METRIC RANK
9.7%
DISABILITY AGE 35 TO 64
99.9/ 100
METRIC RATING
39th/ 347
METRIC RANK
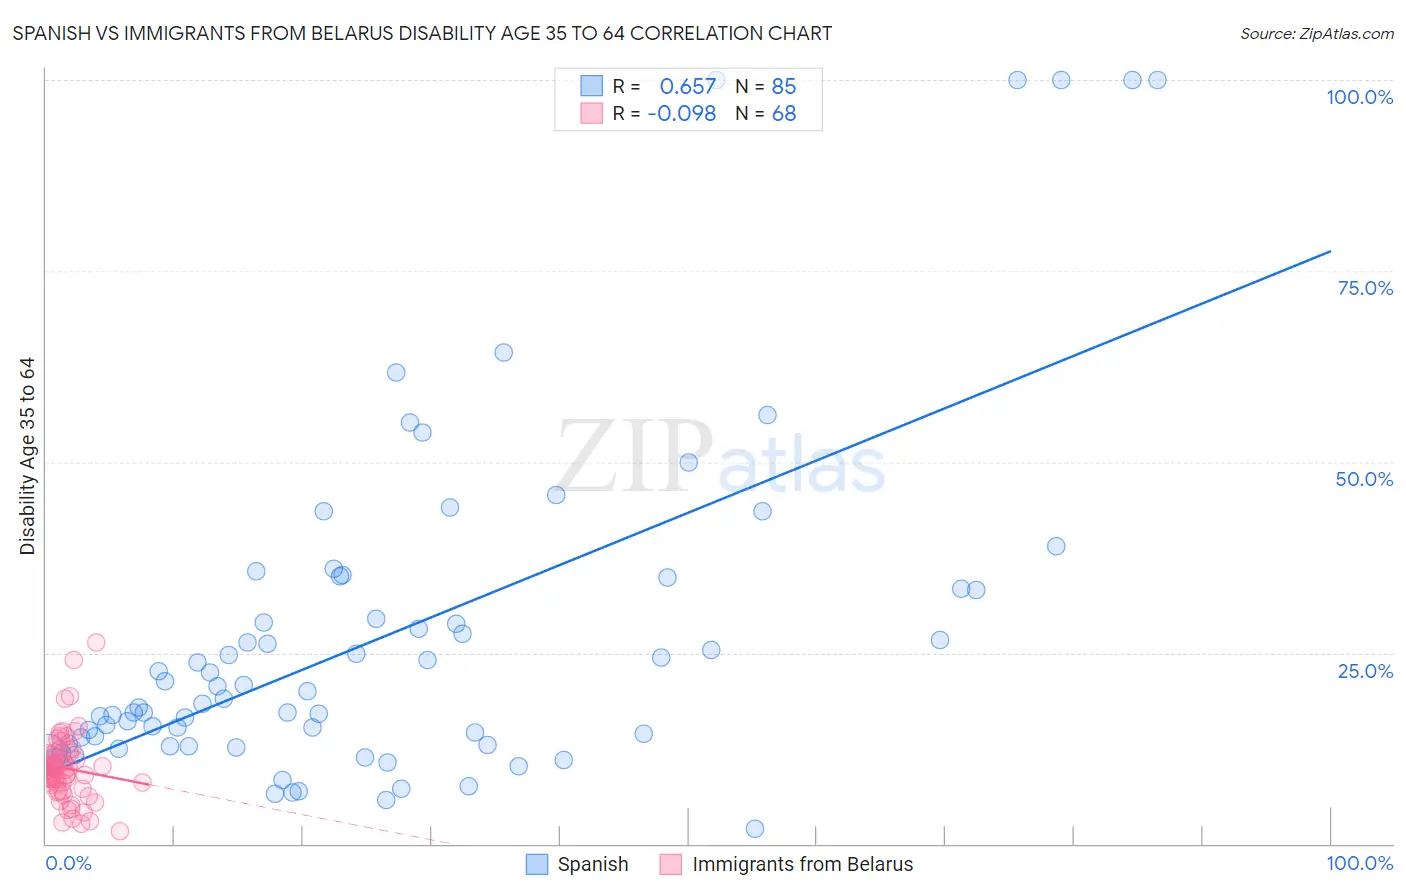
Spanish vs Immigrants from Belarus Disability Age 35 to 64 Correlation Chart
The statistical analysis conducted on geographies consisting of 421,846,574 people shows a significant positive correlation between the proportion of Spanish and percentage of population with a disability between the ages 34 and 64 in the United States with a correlation coefficient (R) of 0.657 and weighted average of 12.7%. Similarly, the statistical analysis conducted on geographies consisting of 150,185,120 people shows a slight negative correlation between the proportion of Immigrants from Belarus and percentage of population with a disability between the ages 34 and 64 in the United States with a correlation coefficient (R) of -0.098 and weighted average of 9.7%, a difference of 30.6%.
Disability Age 35 to 64 Correlation Summary
| Measurement | Spanish | Immigrants from Belarus |
| Minimum | 2.0% | 1.6% |
| Maximum | 100.0% | 26.4% |
| Range | 98.0% | 24.8% |
| Mean | 27.5% | 9.9% |
| Median | 19.9% | 9.5% |
| Interquartile 25% (IQ1) | 13.1% | 7.4% |
| Interquartile 75% (IQ3) | 34.1% | 11.8% |
| Interquartile Range (IQR) | 21.1% | 4.4% |
| Standard Deviation (Sample) | 22.7% | 4.5% |
| Standard Deviation (Population) | 22.5% | 4.5% |
Similar Demographics by Disability Age 35 to 64
Demographics Similar to Spanish by Disability Age 35 to 64
In terms of disability age 35 to 64, the demographic groups most similar to Spanish are French (12.7%, a difference of 0.040%), Immigrants from Dominica (12.7%, a difference of 0.10%), Subsaharan African (12.6%, a difference of 0.28%), White/Caucasian (12.6%, a difference of 0.44%), and Nepalese (12.8%, a difference of 1.1%).
| Demographics | Rating | Rank | Disability Age 35 to 64 |
| Senegalese | 0.5 /100 | #262 | Tragic 12.5% |
| Immigrants | Zaire | 0.4 /100 | #263 | Tragic 12.5% |
| Immigrants | Portugal | 0.4 /100 | #264 | Tragic 12.5% |
| Marshallese | 0.4 /100 | #265 | Tragic 12.5% |
| Whites/Caucasians | 0.3 /100 | #266 | Tragic 12.6% |
| Sub-Saharan Africans | 0.2 /100 | #267 | Tragic 12.6% |
| Immigrants | Dominica | 0.2 /100 | #268 | Tragic 12.7% |
| Spanish | 0.2 /100 | #269 | Tragic 12.7% |
| French | 0.2 /100 | #270 | Tragic 12.7% |
| Nepalese | 0.1 /100 | #271 | Tragic 12.8% |
| U.S. Virgin Islanders | 0.1 /100 | #272 | Tragic 12.8% |
| Pennsylvania Germans | 0.1 /100 | #273 | Tragic 12.8% |
| Celtics | 0.1 /100 | #274 | Tragic 12.9% |
| Dominicans | 0.1 /100 | #275 | Tragic 12.9% |
| Somalis | 0.1 /100 | #276 | Tragic 12.9% |
Demographics Similar to Immigrants from Belarus by Disability Age 35 to 64
In terms of disability age 35 to 64, the demographic groups most similar to Immigrants from Belarus are Immigrants from Armenia (9.7%, a difference of 0.070%), Egyptian (9.7%, a difference of 0.17%), Israeli (9.7%, a difference of 0.18%), Immigrants from Turkey (9.7%, a difference of 0.24%), and Immigrants from Cuba (9.7%, a difference of 0.32%).
| Demographics | Rating | Rank | Disability Age 35 to 64 |
| Turks | 99.9 /100 | #32 | Exceptional 9.7% |
| Immigrants | Indonesia | 99.9 /100 | #33 | Exceptional 9.7% |
| Immigrants | Australia | 99.9 /100 | #34 | Exceptional 9.7% |
| Bulgarians | 99.9 /100 | #35 | Exceptional 9.7% |
| Immigrants | Cuba | 99.9 /100 | #36 | Exceptional 9.7% |
| Immigrants | Turkey | 99.9 /100 | #37 | Exceptional 9.7% |
| Egyptians | 99.9 /100 | #38 | Exceptional 9.7% |
| Immigrants | Belarus | 99.9 /100 | #39 | Exceptional 9.7% |
| Immigrants | Armenia | 99.9 /100 | #40 | Exceptional 9.7% |
| Israelis | 99.9 /100 | #41 | Exceptional 9.7% |
| Immigrants | Malaysia | 99.9 /100 | #42 | Exceptional 9.7% |
| Immigrants | Colombia | 99.9 /100 | #43 | Exceptional 9.8% |
| Immigrants | Egypt | 99.9 /100 | #44 | Exceptional 9.8% |
| Immigrants | Peru | 99.9 /100 | #45 | Exceptional 9.8% |
| Cambodians | 99.8 /100 | #46 | Exceptional 9.8% |