Spanish American Indian vs Immigrants from Switzerland College, Under 1 year
COMPARE
Spanish American Indian
Immigrants from Switzerland
College, Under 1 year
College, Under 1 year Comparison
Spanish American Indians
Immigrants from Switzerland
54.0%
COLLEGE, UNDER 1 YEAR
0.0/ 100
METRIC RATING
340th/ 347
METRIC RANK
71.7%
COLLEGE, UNDER 1 YEAR
100.0/ 100
METRIC RATING
18th/ 347
METRIC RANK
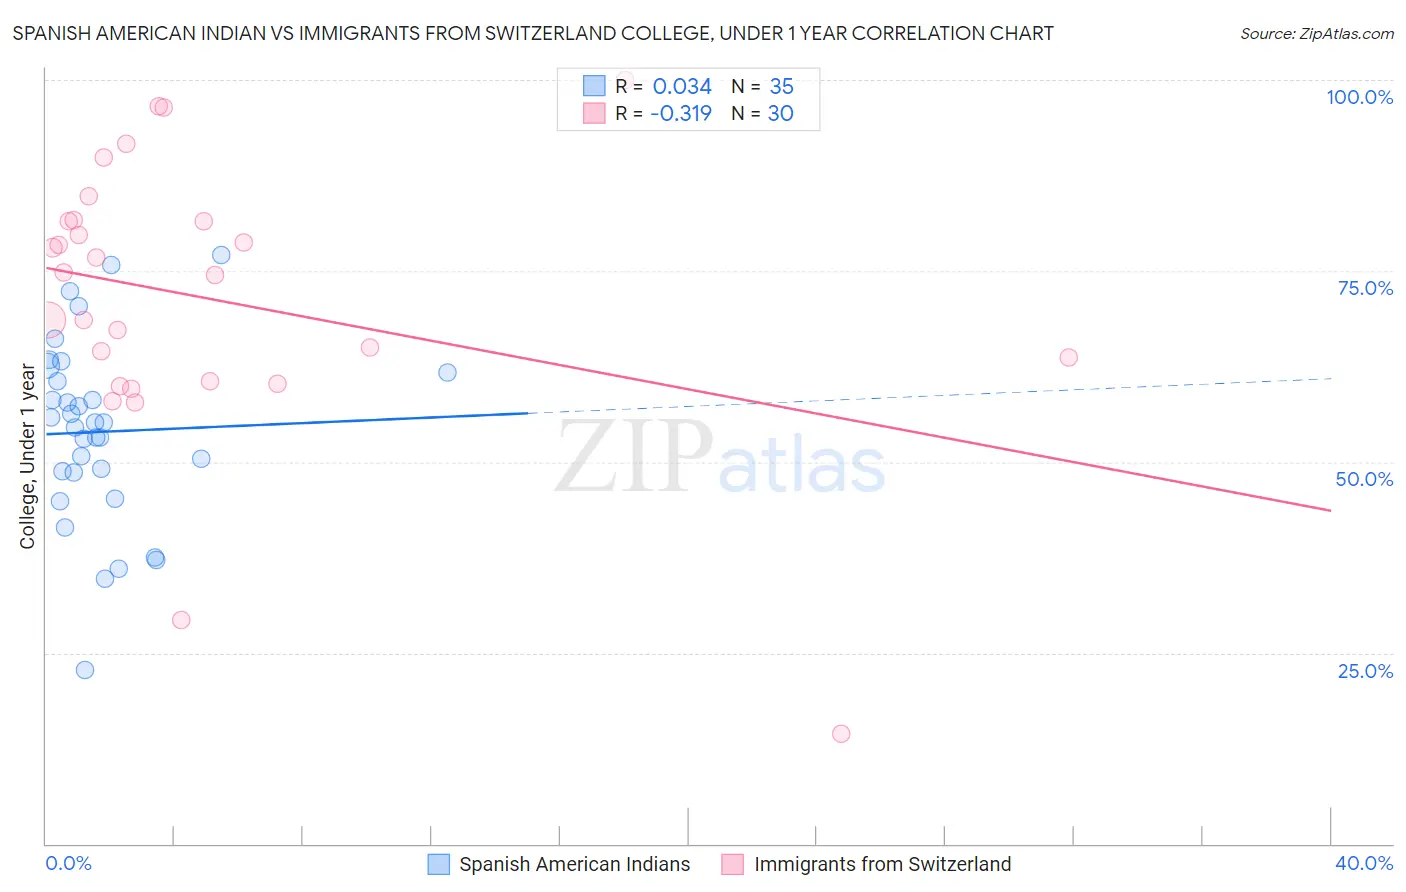
Spanish American Indian vs Immigrants from Switzerland College, Under 1 year Correlation Chart
The statistical analysis conducted on geographies consisting of 73,150,359 people shows no correlation between the proportion of Spanish American Indians and percentage of population with at least college, under 1 year education in the United States with a correlation coefficient (R) of 0.034 and weighted average of 54.0%. Similarly, the statistical analysis conducted on geographies consisting of 148,083,583 people shows a mild negative correlation between the proportion of Immigrants from Switzerland and percentage of population with at least college, under 1 year education in the United States with a correlation coefficient (R) of -0.319 and weighted average of 71.7%, a difference of 32.8%.
College, Under 1 year Correlation Summary
| Measurement | Spanish American Indian | Immigrants from Switzerland |
| Minimum | 22.8% | 14.4% |
| Maximum | 77.0% | 100.0% |
| Range | 54.2% | 85.6% |
| Mean | 53.9% | 71.4% |
| Median | 55.2% | 74.6% |
| Interquartile 25% (IQ1) | 48.7% | 60.6% |
| Interquartile 75% (IQ3) | 61.8% | 81.5% |
| Interquartile Range (IQR) | 13.1% | 20.9% |
| Standard Deviation (Sample) | 11.9% | 18.2% |
| Standard Deviation (Population) | 11.7% | 17.9% |
Similar Demographics by College, Under 1 year
Demographics Similar to Spanish American Indians by College, Under 1 year
In terms of college, under 1 year, the demographic groups most similar to Spanish American Indians are Immigrants from Dominican Republic (54.0%, a difference of 0.090%), Lumbee (54.2%, a difference of 0.49%), Immigrants from Cabo Verde (53.7%, a difference of 0.51%), Immigrants from Mexico (53.7%, a difference of 0.57%), and Immigrants from Central America (54.4%, a difference of 0.90%).
| Demographics | Rating | Rank | College, Under 1 year |
| Yuman | 0.0 /100 | #333 | Tragic 55.1% |
| Immigrants | Azores | 0.0 /100 | #334 | Tragic 54.7% |
| Inupiat | 0.0 /100 | #335 | Tragic 54.6% |
| Pennsylvania Germans | 0.0 /100 | #336 | Tragic 54.5% |
| Immigrants | Central America | 0.0 /100 | #337 | Tragic 54.4% |
| Lumbee | 0.0 /100 | #338 | Tragic 54.2% |
| Immigrants | Dominican Republic | 0.0 /100 | #339 | Tragic 54.0% |
| Spanish American Indians | 0.0 /100 | #340 | Tragic 54.0% |
| Immigrants | Cabo Verde | 0.0 /100 | #341 | Tragic 53.7% |
| Immigrants | Mexico | 0.0 /100 | #342 | Tragic 53.7% |
| Tohono O'odham | 0.0 /100 | #343 | Tragic 52.8% |
| Yakama | 0.0 /100 | #344 | Tragic 52.6% |
| Pima | 0.0 /100 | #345 | Tragic 51.4% |
| Houma | 0.0 /100 | #346 | Tragic 47.6% |
| Yup'ik | 0.0 /100 | #347 | Tragic 45.8% |
Demographics Similar to Immigrants from Switzerland by College, Under 1 year
In terms of college, under 1 year, the demographic groups most similar to Immigrants from Switzerland are Latvian (71.6%, a difference of 0.11%), Eastern European (71.8%, a difference of 0.13%), Immigrants from Korea (71.6%, a difference of 0.15%), Immigrants from Japan (71.9%, a difference of 0.28%), and Cambodian (71.9%, a difference of 0.29%).
| Demographics | Rating | Rank | College, Under 1 year |
| Immigrants | South Central Asia | 100.0 /100 | #11 | Exceptional 72.1% |
| Immigrants | Sweden | 100.0 /100 | #12 | Exceptional 72.1% |
| Cypriots | 100.0 /100 | #13 | Exceptional 72.0% |
| Cambodians | 100.0 /100 | #14 | Exceptional 71.9% |
| Burmese | 100.0 /100 | #15 | Exceptional 71.9% |
| Immigrants | Japan | 100.0 /100 | #16 | Exceptional 71.9% |
| Eastern Europeans | 100.0 /100 | #17 | Exceptional 71.8% |
| Immigrants | Switzerland | 100.0 /100 | #18 | Exceptional 71.7% |
| Latvians | 100.0 /100 | #19 | Exceptional 71.6% |
| Immigrants | Korea | 100.0 /100 | #20 | Exceptional 71.6% |
| Immigrants | Belgium | 100.0 /100 | #21 | Exceptional 71.5% |
| Immigrants | Eastern Asia | 100.0 /100 | #22 | Exceptional 71.3% |
| Immigrants | Northern Europe | 100.0 /100 | #23 | Exceptional 71.1% |
| Soviet Union | 100.0 /100 | #24 | Exceptional 71.1% |
| Bulgarians | 100.0 /100 | #25 | Exceptional 71.1% |