European vs Immigrants from Switzerland College, Under 1 year
COMPARE
European
Immigrants from Switzerland
College, Under 1 year
College, Under 1 year Comparison
Europeans
Immigrants from Switzerland
68.2%
COLLEGE, UNDER 1 YEAR
98.1/ 100
METRIC RATING
91st/ 347
METRIC RANK
71.7%
COLLEGE, UNDER 1 YEAR
100.0/ 100
METRIC RATING
18th/ 347
METRIC RANK
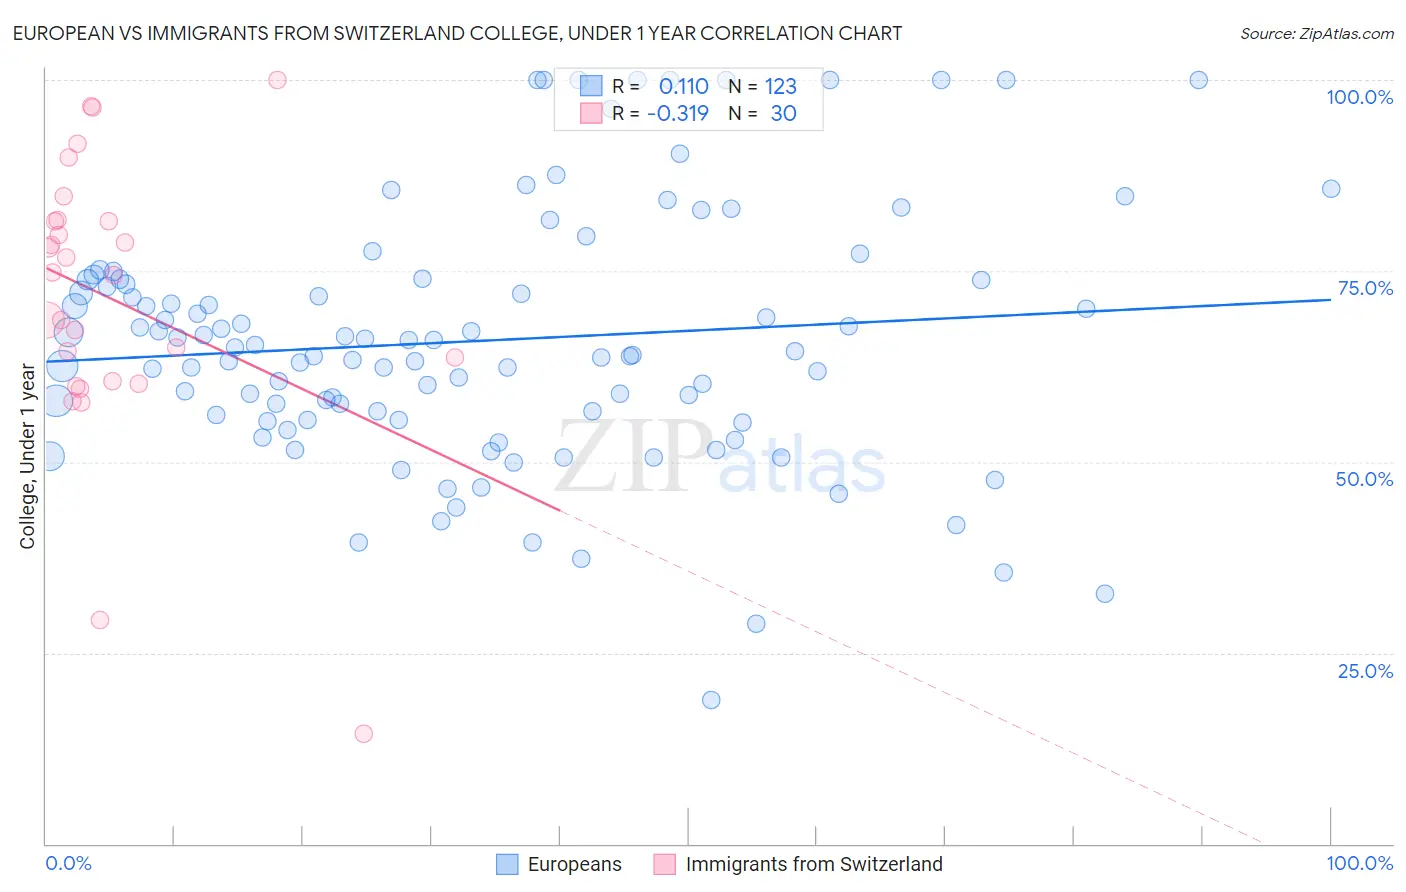
European vs Immigrants from Switzerland College, Under 1 year Correlation Chart
The statistical analysis conducted on geographies consisting of 561,822,807 people shows a poor positive correlation between the proportion of Europeans and percentage of population with at least college, under 1 year education in the United States with a correlation coefficient (R) of 0.110 and weighted average of 68.2%. Similarly, the statistical analysis conducted on geographies consisting of 148,083,583 people shows a mild negative correlation between the proportion of Immigrants from Switzerland and percentage of population with at least college, under 1 year education in the United States with a correlation coefficient (R) of -0.319 and weighted average of 71.7%, a difference of 5.0%.
College, Under 1 year Correlation Summary
| Measurement | European | Immigrants from Switzerland |
| Minimum | 18.7% | 14.4% |
| Maximum | 100.0% | 100.0% |
| Range | 81.3% | 85.6% |
| Mean | 65.8% | 71.4% |
| Median | 64.5% | 74.6% |
| Interquartile 25% (IQ1) | 55.6% | 60.6% |
| Interquartile 75% (IQ3) | 73.9% | 81.5% |
| Interquartile Range (IQR) | 18.3% | 20.9% |
| Standard Deviation (Sample) | 16.5% | 18.2% |
| Standard Deviation (Population) | 16.4% | 17.9% |
Similar Demographics by College, Under 1 year
Demographics Similar to Europeans by College, Under 1 year
In terms of college, under 1 year, the demographic groups most similar to Europeans are Luxembourger (68.2%, a difference of 0.010%), Icelander (68.3%, a difference of 0.030%), Croatian (68.3%, a difference of 0.090%), Ethiopian (68.3%, a difference of 0.090%), and Romanian (68.2%, a difference of 0.10%).
| Demographics | Rating | Rank | College, Under 1 year |
| Immigrants | Hungary | 98.3 /100 | #84 | Exceptional 68.3% |
| Egyptians | 98.3 /100 | #85 | Exceptional 68.3% |
| Immigrants | Lebanon | 98.3 /100 | #86 | Exceptional 68.3% |
| Chinese | 98.3 /100 | #87 | Exceptional 68.3% |
| Croatians | 98.2 /100 | #88 | Exceptional 68.3% |
| Ethiopians | 98.2 /100 | #89 | Exceptional 68.3% |
| Icelanders | 98.1 /100 | #90 | Exceptional 68.3% |
| Europeans | 98.1 /100 | #91 | Exceptional 68.2% |
| Luxembourgers | 98.1 /100 | #92 | Exceptional 68.2% |
| Romanians | 97.9 /100 | #93 | Exceptional 68.2% |
| Armenians | 97.7 /100 | #94 | Exceptional 68.1% |
| Immigrants | Pakistan | 97.5 /100 | #95 | Exceptional 68.0% |
| Jordanians | 97.4 /100 | #96 | Exceptional 68.0% |
| Immigrants | Ethiopia | 97.3 /100 | #97 | Exceptional 68.0% |
| Paraguayans | 97.1 /100 | #98 | Exceptional 67.9% |
Demographics Similar to Immigrants from Switzerland by College, Under 1 year
In terms of college, under 1 year, the demographic groups most similar to Immigrants from Switzerland are Latvian (71.6%, a difference of 0.11%), Eastern European (71.8%, a difference of 0.13%), Immigrants from Korea (71.6%, a difference of 0.15%), Immigrants from Japan (71.9%, a difference of 0.28%), and Cambodian (71.9%, a difference of 0.29%).
| Demographics | Rating | Rank | College, Under 1 year |
| Immigrants | South Central Asia | 100.0 /100 | #11 | Exceptional 72.1% |
| Immigrants | Sweden | 100.0 /100 | #12 | Exceptional 72.1% |
| Cypriots | 100.0 /100 | #13 | Exceptional 72.0% |
| Cambodians | 100.0 /100 | #14 | Exceptional 71.9% |
| Burmese | 100.0 /100 | #15 | Exceptional 71.9% |
| Immigrants | Japan | 100.0 /100 | #16 | Exceptional 71.9% |
| Eastern Europeans | 100.0 /100 | #17 | Exceptional 71.8% |
| Immigrants | Switzerland | 100.0 /100 | #18 | Exceptional 71.7% |
| Latvians | 100.0 /100 | #19 | Exceptional 71.6% |
| Immigrants | Korea | 100.0 /100 | #20 | Exceptional 71.6% |
| Immigrants | Belgium | 100.0 /100 | #21 | Exceptional 71.5% |
| Immigrants | Eastern Asia | 100.0 /100 | #22 | Exceptional 71.3% |
| Immigrants | Northern Europe | 100.0 /100 | #23 | Exceptional 71.1% |
| Soviet Union | 100.0 /100 | #24 | Exceptional 71.1% |
| Bulgarians | 100.0 /100 | #25 | Exceptional 71.1% |