Spanish American Indian vs Puget Sound Salish College, Under 1 year
COMPARE
Spanish American Indian
Puget Sound Salish
College, Under 1 year
College, Under 1 year Comparison
Spanish American Indians
Puget Sound Salish
54.0%
COLLEGE, UNDER 1 YEAR
0.0/ 100
METRIC RATING
340th/ 347
METRIC RANK
63.9%
COLLEGE, UNDER 1 YEAR
11.3/ 100
METRIC RATING
209th/ 347
METRIC RANK
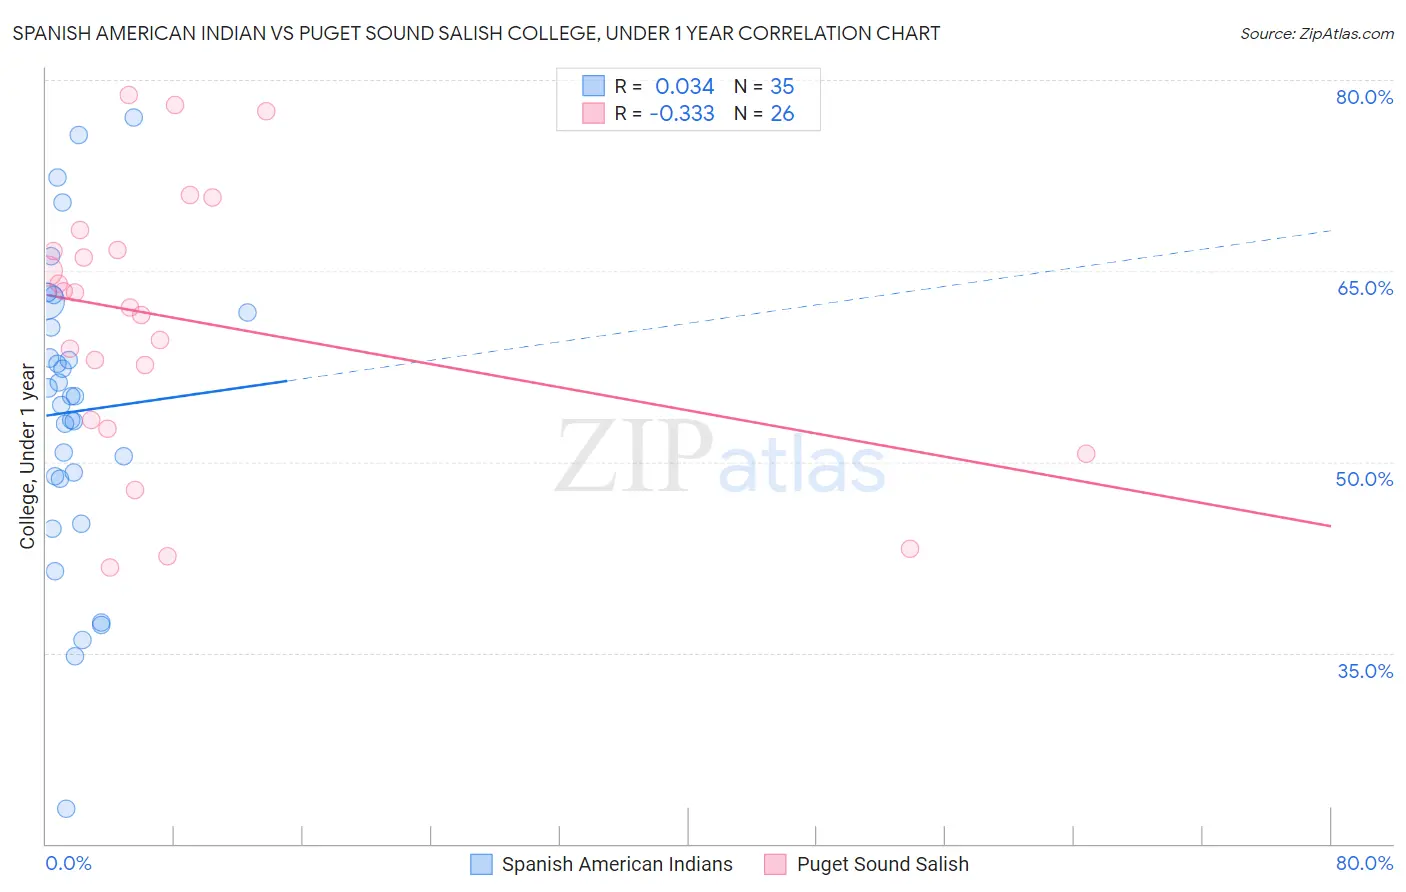
Spanish American Indian vs Puget Sound Salish College, Under 1 year Correlation Chart
The statistical analysis conducted on geographies consisting of 73,150,359 people shows no correlation between the proportion of Spanish American Indians and percentage of population with at least college, under 1 year education in the United States with a correlation coefficient (R) of 0.034 and weighted average of 54.0%. Similarly, the statistical analysis conducted on geographies consisting of 46,155,865 people shows a mild negative correlation between the proportion of Puget Sound Salish and percentage of population with at least college, under 1 year education in the United States with a correlation coefficient (R) of -0.333 and weighted average of 63.9%, a difference of 18.5%.
College, Under 1 year Correlation Summary
| Measurement | Spanish American Indian | Puget Sound Salish |
| Minimum | 22.8% | 41.7% |
| Maximum | 77.0% | 78.8% |
| Range | 54.2% | 37.1% |
| Mean | 53.9% | 61.1% |
| Median | 55.2% | 62.7% |
| Interquartile 25% (IQ1) | 48.7% | 53.3% |
| Interquartile 75% (IQ3) | 61.8% | 66.7% |
| Interquartile Range (IQR) | 13.1% | 13.3% |
| Standard Deviation (Sample) | 11.9% | 10.4% |
| Standard Deviation (Population) | 11.7% | 10.2% |
Similar Demographics by College, Under 1 year
Demographics Similar to Spanish American Indians by College, Under 1 year
In terms of college, under 1 year, the demographic groups most similar to Spanish American Indians are Immigrants from Dominican Republic (54.0%, a difference of 0.090%), Lumbee (54.2%, a difference of 0.49%), Immigrants from Cabo Verde (53.7%, a difference of 0.51%), Immigrants from Mexico (53.7%, a difference of 0.57%), and Immigrants from Central America (54.4%, a difference of 0.90%).
| Demographics | Rating | Rank | College, Under 1 year |
| Yuman | 0.0 /100 | #333 | Tragic 55.1% |
| Immigrants | Azores | 0.0 /100 | #334 | Tragic 54.7% |
| Inupiat | 0.0 /100 | #335 | Tragic 54.6% |
| Pennsylvania Germans | 0.0 /100 | #336 | Tragic 54.5% |
| Immigrants | Central America | 0.0 /100 | #337 | Tragic 54.4% |
| Lumbee | 0.0 /100 | #338 | Tragic 54.2% |
| Immigrants | Dominican Republic | 0.0 /100 | #339 | Tragic 54.0% |
| Spanish American Indians | 0.0 /100 | #340 | Tragic 54.0% |
| Immigrants | Cabo Verde | 0.0 /100 | #341 | Tragic 53.7% |
| Immigrants | Mexico | 0.0 /100 | #342 | Tragic 53.7% |
| Tohono O'odham | 0.0 /100 | #343 | Tragic 52.8% |
| Yakama | 0.0 /100 | #344 | Tragic 52.6% |
| Pima | 0.0 /100 | #345 | Tragic 51.4% |
| Houma | 0.0 /100 | #346 | Tragic 47.6% |
| Yup'ik | 0.0 /100 | #347 | Tragic 45.8% |
Demographics Similar to Puget Sound Salish by College, Under 1 year
In terms of college, under 1 year, the demographic groups most similar to Puget Sound Salish are Ghanaian (63.9%, a difference of 0.010%), Native Hawaiian (63.9%, a difference of 0.080%), Immigrants from Vietnam (64.0%, a difference of 0.090%), Immigrants from Middle Africa (63.9%, a difference of 0.090%), and Colombian (64.0%, a difference of 0.12%).
| Demographics | Rating | Rank | College, Under 1 year |
| South Americans | 16.2 /100 | #202 | Poor 64.2% |
| Uruguayans | 15.6 /100 | #203 | Poor 64.2% |
| Immigrants | Zaire | 14.6 /100 | #204 | Poor 64.1% |
| Peruvians | 13.7 /100 | #205 | Poor 64.1% |
| Whites/Caucasians | 12.8 /100 | #206 | Poor 64.0% |
| Colombians | 12.4 /100 | #207 | Poor 64.0% |
| Immigrants | Vietnam | 12.1 /100 | #208 | Poor 64.0% |
| Puget Sound Salish | 11.3 /100 | #209 | Poor 63.9% |
| Ghanaians | 11.2 /100 | #210 | Poor 63.9% |
| Native Hawaiians | 10.6 /100 | #211 | Poor 63.9% |
| Immigrants | Middle Africa | 10.5 /100 | #212 | Poor 63.9% |
| Immigrants | South America | 9.1 /100 | #213 | Tragic 63.8% |
| Immigrants | Nigeria | 8.8 /100 | #214 | Tragic 63.7% |
| Senegalese | 7.7 /100 | #215 | Tragic 63.6% |
| Hmong | 6.8 /100 | #216 | Tragic 63.5% |