Spanish American Indian vs French College, Under 1 year
COMPARE
Spanish American Indian
French
College, Under 1 year
College, Under 1 year Comparison
Spanish American Indians
French
54.0%
COLLEGE, UNDER 1 YEAR
0.0/ 100
METRIC RATING
340th/ 347
METRIC RANK
65.4%
COLLEGE, UNDER 1 YEAR
48.9/ 100
METRIC RATING
176th/ 347
METRIC RANK
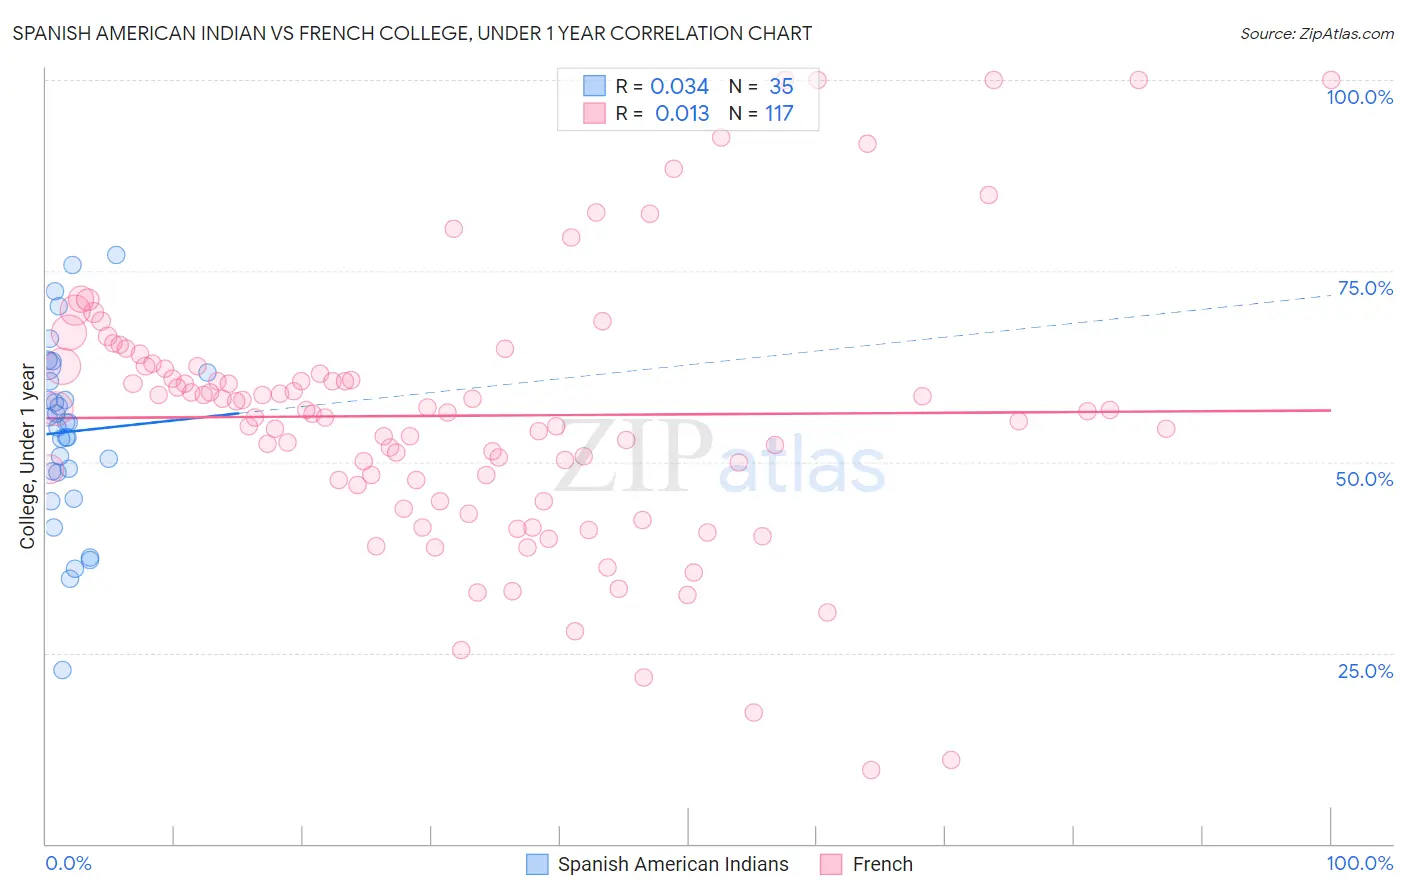
Spanish American Indian vs French College, Under 1 year Correlation Chart
The statistical analysis conducted on geographies consisting of 73,150,359 people shows no correlation between the proportion of Spanish American Indians and percentage of population with at least college, under 1 year education in the United States with a correlation coefficient (R) of 0.034 and weighted average of 54.0%. Similarly, the statistical analysis conducted on geographies consisting of 572,421,554 people shows no correlation between the proportion of French and percentage of population with at least college, under 1 year education in the United States with a correlation coefficient (R) of 0.013 and weighted average of 65.4%, a difference of 21.2%.
College, Under 1 year Correlation Summary
| Measurement | Spanish American Indian | French |
| Minimum | 22.8% | 9.7% |
| Maximum | 77.0% | 100.0% |
| Range | 54.2% | 90.3% |
| Mean | 53.9% | 56.0% |
| Median | 55.2% | 56.6% |
| Interquartile 25% (IQ1) | 48.7% | 47.3% |
| Interquartile 75% (IQ3) | 61.8% | 62.5% |
| Interquartile Range (IQR) | 13.1% | 15.2% |
| Standard Deviation (Sample) | 11.9% | 17.4% |
| Standard Deviation (Population) | 11.7% | 17.3% |
Similar Demographics by College, Under 1 year
Demographics Similar to Spanish American Indians by College, Under 1 year
In terms of college, under 1 year, the demographic groups most similar to Spanish American Indians are Immigrants from Dominican Republic (54.0%, a difference of 0.090%), Lumbee (54.2%, a difference of 0.49%), Immigrants from Cabo Verde (53.7%, a difference of 0.51%), Immigrants from Mexico (53.7%, a difference of 0.57%), and Immigrants from Central America (54.4%, a difference of 0.90%).
| Demographics | Rating | Rank | College, Under 1 year |
| Yuman | 0.0 /100 | #333 | Tragic 55.1% |
| Immigrants | Azores | 0.0 /100 | #334 | Tragic 54.7% |
| Inupiat | 0.0 /100 | #335 | Tragic 54.6% |
| Pennsylvania Germans | 0.0 /100 | #336 | Tragic 54.5% |
| Immigrants | Central America | 0.0 /100 | #337 | Tragic 54.4% |
| Lumbee | 0.0 /100 | #338 | Tragic 54.2% |
| Immigrants | Dominican Republic | 0.0 /100 | #339 | Tragic 54.0% |
| Spanish American Indians | 0.0 /100 | #340 | Tragic 54.0% |
| Immigrants | Cabo Verde | 0.0 /100 | #341 | Tragic 53.7% |
| Immigrants | Mexico | 0.0 /100 | #342 | Tragic 53.7% |
| Tohono O'odham | 0.0 /100 | #343 | Tragic 52.8% |
| Yakama | 0.0 /100 | #344 | Tragic 52.6% |
| Pima | 0.0 /100 | #345 | Tragic 51.4% |
| Houma | 0.0 /100 | #346 | Tragic 47.6% |
| Yup'ik | 0.0 /100 | #347 | Tragic 45.8% |
Demographics Similar to French by College, Under 1 year
In terms of college, under 1 year, the demographic groups most similar to French are Immigrants from North Macedonia (65.4%, a difference of 0.010%), Scotch-Irish (65.4%, a difference of 0.030%), German Russian (65.4%, a difference of 0.030%), Guamanian/Chamorro (65.4%, a difference of 0.030%), and Immigrants from Bosnia and Herzegovina (65.4%, a difference of 0.050%).
| Demographics | Rating | Rank | College, Under 1 year |
| Yugoslavians | 55.7 /100 | #169 | Average 65.6% |
| Germans | 55.7 /100 | #170 | Average 65.6% |
| Immigrants | Oceania | 55.0 /100 | #171 | Average 65.6% |
| South American Indians | 54.4 /100 | #172 | Average 65.5% |
| Swiss | 53.9 /100 | #173 | Average 65.5% |
| Immigrants | Bosnia and Herzegovina | 50.0 /100 | #174 | Average 65.4% |
| Scotch-Irish | 49.5 /100 | #175 | Average 65.4% |
| French | 48.9 /100 | #176 | Average 65.4% |
| Immigrants | North Macedonia | 48.6 /100 | #177 | Average 65.4% |
| German Russians | 48.3 /100 | #178 | Average 65.4% |
| Guamanians/Chamorros | 48.2 /100 | #179 | Average 65.4% |
| Dutch | 46.1 /100 | #180 | Average 65.3% |
| Spaniards | 45.5 /100 | #181 | Average 65.3% |
| Immigrants | Africa | 44.7 /100 | #182 | Average 65.3% |
| Immigrants | Poland | 42.6 /100 | #183 | Average 65.2% |