Spanish American Indian vs Sri Lankan College, Under 1 year
COMPARE
Spanish American Indian
Sri Lankan
College, Under 1 year
College, Under 1 year Comparison
Spanish American Indians
Sri Lankans
54.0%
COLLEGE, UNDER 1 YEAR
0.0/ 100
METRIC RATING
340th/ 347
METRIC RANK
65.2%
COLLEGE, UNDER 1 YEAR
41.7/ 100
METRIC RATING
185th/ 347
METRIC RANK
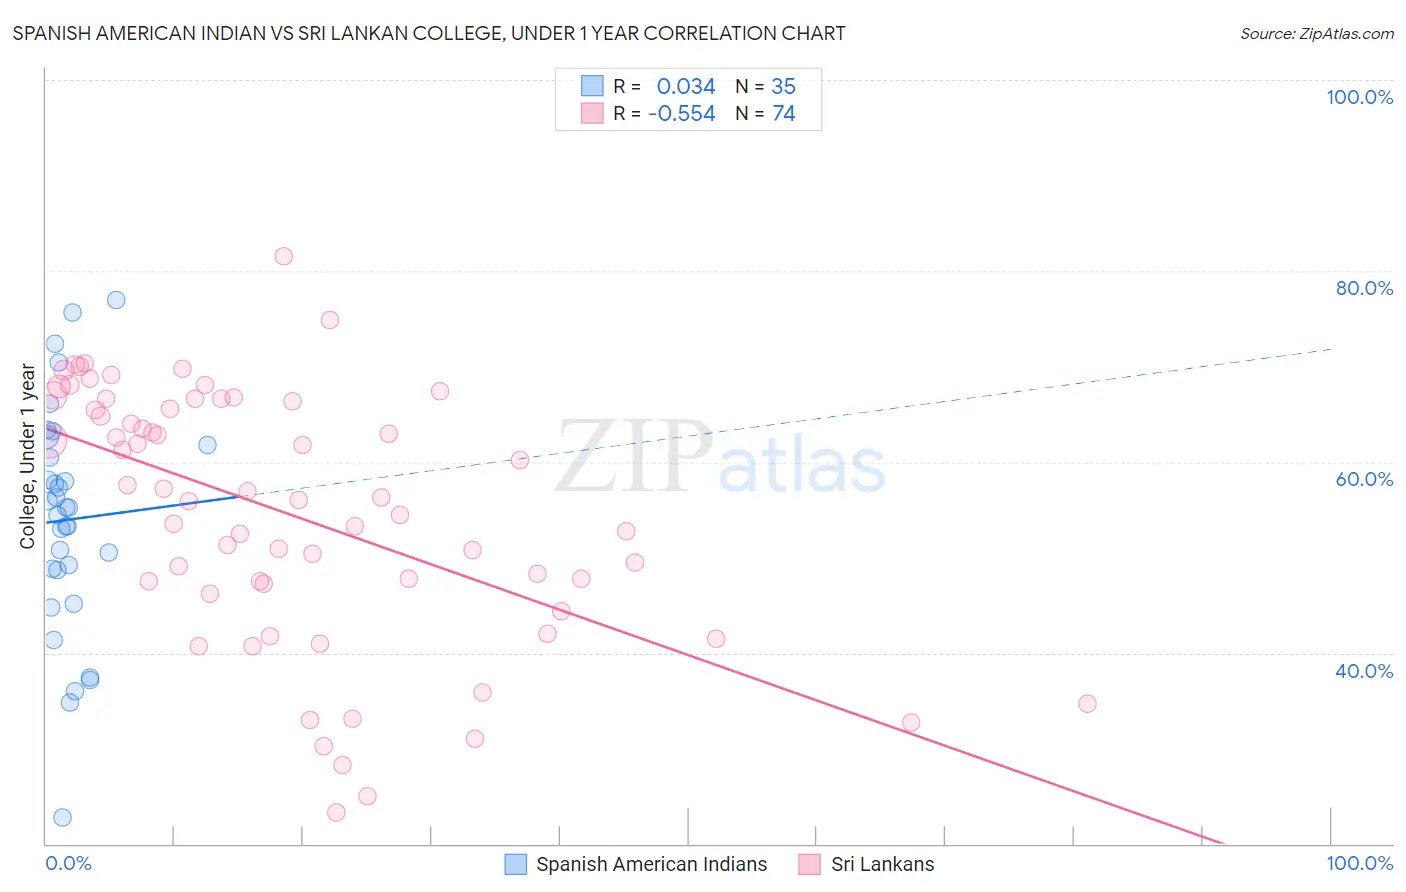
Spanish American Indian vs Sri Lankan College, Under 1 year Correlation Chart
The statistical analysis conducted on geographies consisting of 73,150,359 people shows no correlation between the proportion of Spanish American Indians and percentage of population with at least college, under 1 year education in the United States with a correlation coefficient (R) of 0.034 and weighted average of 54.0%. Similarly, the statistical analysis conducted on geographies consisting of 440,590,245 people shows a substantial negative correlation between the proportion of Sri Lankans and percentage of population with at least college, under 1 year education in the United States with a correlation coefficient (R) of -0.554 and weighted average of 65.2%, a difference of 20.8%.
College, Under 1 year Correlation Summary
| Measurement | Spanish American Indian | Sri Lankan |
| Minimum | 22.8% | 23.3% |
| Maximum | 77.0% | 81.5% |
| Range | 54.2% | 58.3% |
| Mean | 53.9% | 54.6% |
| Median | 55.2% | 56.1% |
| Interquartile 25% (IQ1) | 48.7% | 47.3% |
| Interquartile 75% (IQ3) | 61.8% | 66.4% |
| Interquartile Range (IQR) | 13.1% | 19.1% |
| Standard Deviation (Sample) | 11.9% | 13.3% |
| Standard Deviation (Population) | 11.7% | 13.2% |
Similar Demographics by College, Under 1 year
Demographics Similar to Spanish American Indians by College, Under 1 year
In terms of college, under 1 year, the demographic groups most similar to Spanish American Indians are Immigrants from Dominican Republic (54.0%, a difference of 0.090%), Lumbee (54.2%, a difference of 0.49%), Immigrants from Cabo Verde (53.7%, a difference of 0.51%), Immigrants from Mexico (53.7%, a difference of 0.57%), and Immigrants from Central America (54.4%, a difference of 0.90%).
| Demographics | Rating | Rank | College, Under 1 year |
| Yuman | 0.0 /100 | #333 | Tragic 55.1% |
| Immigrants | Azores | 0.0 /100 | #334 | Tragic 54.7% |
| Inupiat | 0.0 /100 | #335 | Tragic 54.6% |
| Pennsylvania Germans | 0.0 /100 | #336 | Tragic 54.5% |
| Immigrants | Central America | 0.0 /100 | #337 | Tragic 54.4% |
| Lumbee | 0.0 /100 | #338 | Tragic 54.2% |
| Immigrants | Dominican Republic | 0.0 /100 | #339 | Tragic 54.0% |
| Spanish American Indians | 0.0 /100 | #340 | Tragic 54.0% |
| Immigrants | Cabo Verde | 0.0 /100 | #341 | Tragic 53.7% |
| Immigrants | Mexico | 0.0 /100 | #342 | Tragic 53.7% |
| Tohono O'odham | 0.0 /100 | #343 | Tragic 52.8% |
| Yakama | 0.0 /100 | #344 | Tragic 52.6% |
| Pima | 0.0 /100 | #345 | Tragic 51.4% |
| Houma | 0.0 /100 | #346 | Tragic 47.6% |
| Yup'ik | 0.0 /100 | #347 | Tragic 45.8% |
Demographics Similar to Sri Lankans by College, Under 1 year
In terms of college, under 1 year, the demographic groups most similar to Sri Lankans are Bermudan (65.2%, a difference of 0.010%), Immigrants from Poland (65.2%, a difference of 0.040%), Immigrants from Sierra Leone (65.1%, a difference of 0.090%), Immigrants from Africa (65.3%, a difference of 0.13%), and Spaniard (65.3%, a difference of 0.17%).
| Demographics | Rating | Rank | College, Under 1 year |
| German Russians | 48.3 /100 | #178 | Average 65.4% |
| Guamanians/Chamorros | 48.2 /100 | #179 | Average 65.4% |
| Dutch | 46.1 /100 | #180 | Average 65.3% |
| Spaniards | 45.5 /100 | #181 | Average 65.3% |
| Immigrants | Africa | 44.7 /100 | #182 | Average 65.3% |
| Immigrants | Poland | 42.6 /100 | #183 | Average 65.2% |
| Bermudans | 42.0 /100 | #184 | Average 65.2% |
| Sri Lankans | 41.7 /100 | #185 | Average 65.2% |
| Immigrants | Sierra Leone | 39.7 /100 | #186 | Fair 65.1% |
| Immigrants | Southern Europe | 34.3 /100 | #187 | Fair 64.9% |
| Immigrants | Albania | 32.0 /100 | #188 | Fair 64.9% |
| Spanish | 31.6 /100 | #189 | Fair 64.9% |
| Immigrants | Philippines | 30.1 /100 | #190 | Fair 64.8% |
| Immigrants | Armenia | 28.1 /100 | #191 | Fair 64.7% |
| Immigrants | Thailand | 27.0 /100 | #192 | Fair 64.7% |