Spanish American Indian vs Immigrants from Switzerland Householder Income Over 65 years
COMPARE
Spanish American Indian
Immigrants from Switzerland
Householder Income Over 65 years
Householder Income Over 65 years Comparison
Spanish American Indians
Immigrants from Switzerland
$53,077
HOUSEHOLDER INCOME OVER 65 YEARS
0.0/ 100
METRIC RATING
302nd/ 347
METRIC RANK
$69,343
HOUSEHOLDER INCOME OVER 65 YEARS
100.0/ 100
METRIC RATING
27th/ 347
METRIC RANK
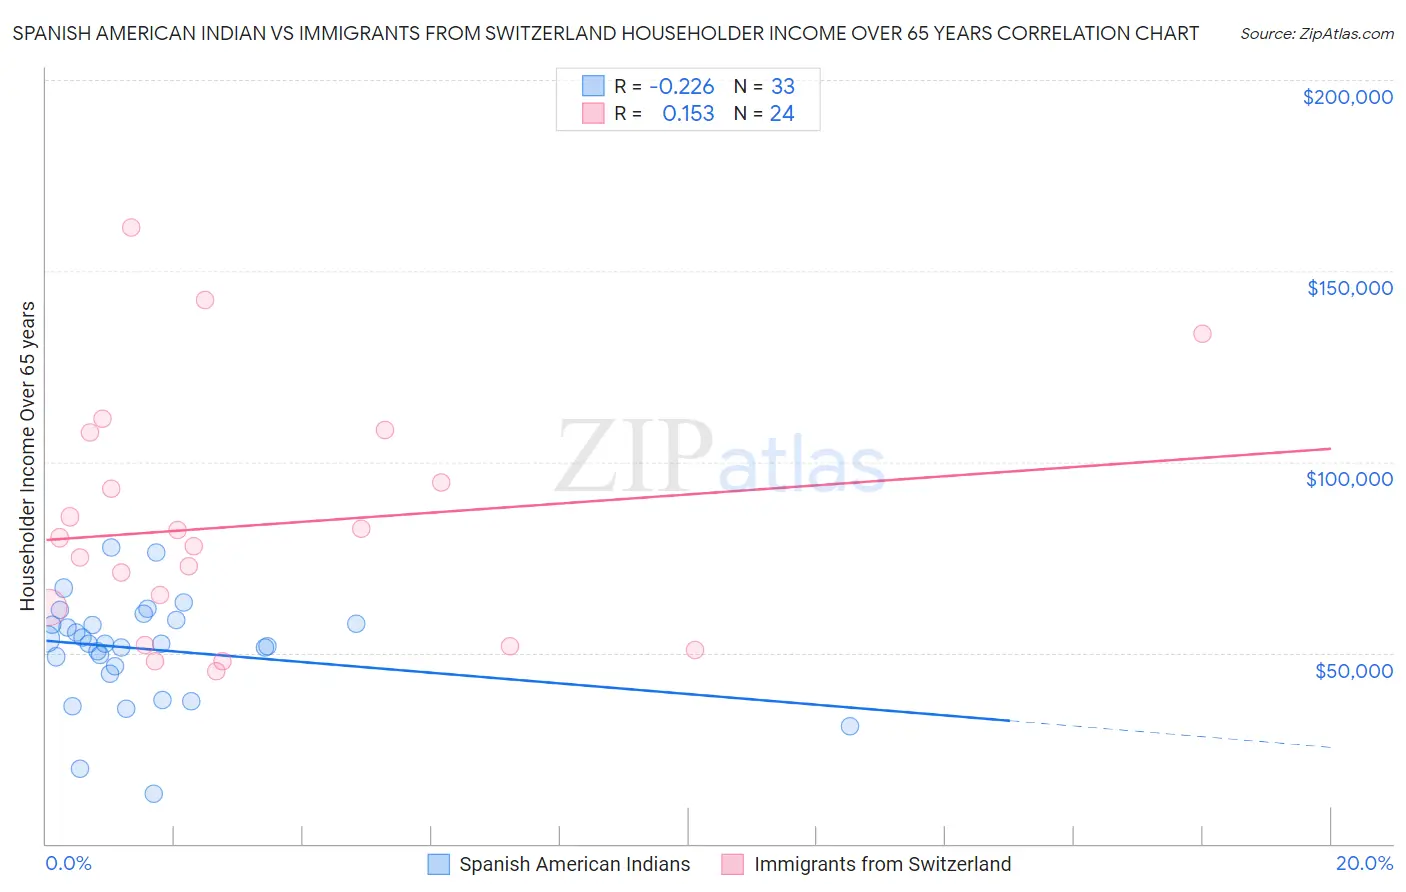
Spanish American Indian vs Immigrants from Switzerland Householder Income Over 65 years Correlation Chart
The statistical analysis conducted on geographies consisting of 73,128,660 people shows a weak negative correlation between the proportion of Spanish American Indians and household income with householder over the age of 65 in the United States with a correlation coefficient (R) of -0.226 and weighted average of $53,077. Similarly, the statistical analysis conducted on geographies consisting of 147,981,547 people shows a poor positive correlation between the proportion of Immigrants from Switzerland and household income with householder over the age of 65 in the United States with a correlation coefficient (R) of 0.153 and weighted average of $69,343, a difference of 30.6%.
Householder Income Over 65 years Correlation Summary
| Measurement | Spanish American Indian | Immigrants from Switzerland |
| Minimum | $13,050 | $45,029 |
| Maximum | $77,490 | $161,506 |
| Range | $64,440 | $116,477 |
| Mean | $50,895 | $83,378 |
| Median | $52,508 | $79,119 |
| Interquartile 25% (IQ1) | $45,560 | $56,976 |
| Interquartile 75% (IQ3) | $58,154 | $101,163 |
| Interquartile Range (IQR) | $12,594 | $44,187 |
| Standard Deviation (Sample) | $13,736 | $31,315 |
| Standard Deviation (Population) | $13,526 | $30,656 |
Similar Demographics by Householder Income Over 65 years
Demographics Similar to Spanish American Indians by Householder Income Over 65 years
In terms of householder income over 65 years, the demographic groups most similar to Spanish American Indians are Choctaw ($53,060, a difference of 0.030%), Yuman ($53,110, a difference of 0.060%), Immigrants from Bahamas ($53,174, a difference of 0.18%), Ute ($52,949, a difference of 0.24%), and Ottawa ($53,217, a difference of 0.27%).
| Demographics | Rating | Rank | Householder Income Over 65 years |
| Immigrants | Central America | 0.0 /100 | #295 | Tragic $53,420 |
| Immigrants | Somalia | 0.0 /100 | #296 | Tragic $53,333 |
| Immigrants | Latin America | 0.0 /100 | #297 | Tragic $53,265 |
| Central American Indians | 0.0 /100 | #298 | Tragic $53,232 |
| Ottawa | 0.0 /100 | #299 | Tragic $53,217 |
| Immigrants | Bahamas | 0.0 /100 | #300 | Tragic $53,174 |
| Yuman | 0.0 /100 | #301 | Tragic $53,110 |
| Spanish American Indians | 0.0 /100 | #302 | Tragic $53,077 |
| Choctaw | 0.0 /100 | #303 | Tragic $53,060 |
| Ute | 0.0 /100 | #304 | Tragic $52,949 |
| Pueblo | 0.0 /100 | #305 | Tragic $52,930 |
| Pennsylvania Germans | 0.0 /100 | #306 | Tragic $52,888 |
| Hispanics or Latinos | 0.0 /100 | #307 | Tragic $52,832 |
| Immigrants | Mexico | 0.0 /100 | #308 | Tragic $52,801 |
| Hondurans | 0.0 /100 | #309 | Tragic $52,634 |
Demographics Similar to Immigrants from Switzerland by Householder Income Over 65 years
In terms of householder income over 65 years, the demographic groups most similar to Immigrants from Switzerland are Immigrants from Sri Lanka ($69,426, a difference of 0.12%), Immigrants from China ($69,174, a difference of 0.25%), Immigrants from Australia ($69,164, a difference of 0.26%), Immigrants from Northern Europe ($69,003, a difference of 0.49%), and Immigrants from Belgium ($69,703, a difference of 0.52%).
| Demographics | Rating | Rank | Householder Income Over 65 years |
| Immigrants | South Central Asia | 100.0 /100 | #20 | Exceptional $70,103 |
| Immigrants | Eastern Asia | 100.0 /100 | #21 | Exceptional $69,872 |
| Immigrants | Israel | 100.0 /100 | #22 | Exceptional $69,857 |
| Immigrants | Japan | 100.0 /100 | #23 | Exceptional $69,774 |
| Immigrants | Sweden | 100.0 /100 | #24 | Exceptional $69,722 |
| Immigrants | Belgium | 100.0 /100 | #25 | Exceptional $69,703 |
| Immigrants | Sri Lanka | 100.0 /100 | #26 | Exceptional $69,426 |
| Immigrants | Switzerland | 100.0 /100 | #27 | Exceptional $69,343 |
| Immigrants | China | 100.0 /100 | #28 | Exceptional $69,174 |
| Immigrants | Australia | 100.0 /100 | #29 | Exceptional $69,164 |
| Immigrants | Northern Europe | 100.0 /100 | #30 | Exceptional $69,003 |
| Afghans | 100.0 /100 | #31 | Exceptional $68,951 |
| Asians | 100.0 /100 | #32 | Exceptional $68,822 |
| Immigrants | Denmark | 100.0 /100 | #33 | Exceptional $68,801 |
| Immigrants | Ireland | 100.0 /100 | #34 | Exceptional $68,495 |