Spanish American Indian vs Israeli College, Under 1 year
COMPARE
Spanish American Indian
Israeli
College, Under 1 year
College, Under 1 year Comparison
Spanish American Indians
Israelis
54.0%
COLLEGE, UNDER 1 YEAR
0.0/ 100
METRIC RATING
340th/ 347
METRIC RANK
70.2%
COLLEGE, UNDER 1 YEAR
99.9/ 100
METRIC RATING
43rd/ 347
METRIC RANK
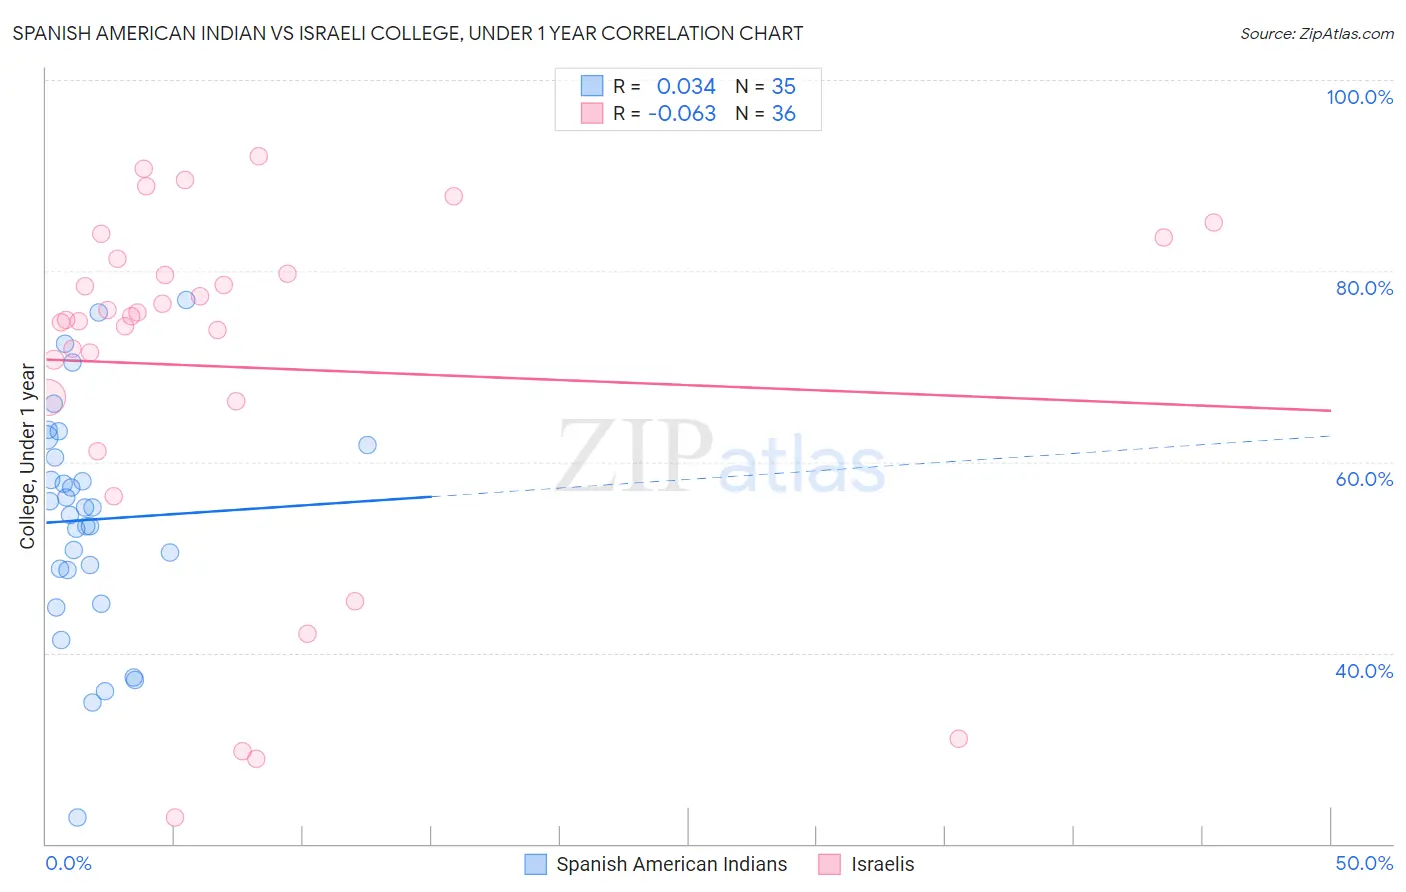
Spanish American Indian vs Israeli College, Under 1 year Correlation Chart
The statistical analysis conducted on geographies consisting of 73,150,359 people shows no correlation between the proportion of Spanish American Indians and percentage of population with at least college, under 1 year education in the United States with a correlation coefficient (R) of 0.034 and weighted average of 54.0%. Similarly, the statistical analysis conducted on geographies consisting of 211,218,479 people shows a slight negative correlation between the proportion of Israelis and percentage of population with at least college, under 1 year education in the United States with a correlation coefficient (R) of -0.063 and weighted average of 70.2%, a difference of 30.2%.
College, Under 1 year Correlation Summary
| Measurement | Spanish American Indian | Israeli |
| Minimum | 22.8% | 22.7% |
| Maximum | 77.0% | 92.0% |
| Range | 54.2% | 69.3% |
| Mean | 53.9% | 69.9% |
| Median | 55.2% | 75.0% |
| Interquartile 25% (IQ1) | 48.7% | 66.5% |
| Interquartile 75% (IQ3) | 61.8% | 80.5% |
| Interquartile Range (IQR) | 13.1% | 14.0% |
| Standard Deviation (Sample) | 11.9% | 18.6% |
| Standard Deviation (Population) | 11.7% | 18.3% |
Similar Demographics by College, Under 1 year
Demographics Similar to Spanish American Indians by College, Under 1 year
In terms of college, under 1 year, the demographic groups most similar to Spanish American Indians are Immigrants from Dominican Republic (54.0%, a difference of 0.090%), Lumbee (54.2%, a difference of 0.49%), Immigrants from Cabo Verde (53.7%, a difference of 0.51%), Immigrants from Mexico (53.7%, a difference of 0.57%), and Immigrants from Central America (54.4%, a difference of 0.90%).
| Demographics | Rating | Rank | College, Under 1 year |
| Yuman | 0.0 /100 | #333 | Tragic 55.1% |
| Immigrants | Azores | 0.0 /100 | #334 | Tragic 54.7% |
| Inupiat | 0.0 /100 | #335 | Tragic 54.6% |
| Pennsylvania Germans | 0.0 /100 | #336 | Tragic 54.5% |
| Immigrants | Central America | 0.0 /100 | #337 | Tragic 54.4% |
| Lumbee | 0.0 /100 | #338 | Tragic 54.2% |
| Immigrants | Dominican Republic | 0.0 /100 | #339 | Tragic 54.0% |
| Spanish American Indians | 0.0 /100 | #340 | Tragic 54.0% |
| Immigrants | Cabo Verde | 0.0 /100 | #341 | Tragic 53.7% |
| Immigrants | Mexico | 0.0 /100 | #342 | Tragic 53.7% |
| Tohono O'odham | 0.0 /100 | #343 | Tragic 52.8% |
| Yakama | 0.0 /100 | #344 | Tragic 52.6% |
| Pima | 0.0 /100 | #345 | Tragic 51.4% |
| Houma | 0.0 /100 | #346 | Tragic 47.6% |
| Yup'ik | 0.0 /100 | #347 | Tragic 45.8% |
Demographics Similar to Israelis by College, Under 1 year
In terms of college, under 1 year, the demographic groups most similar to Israelis are New Zealander (70.2%, a difference of 0.0%), Immigrants from Norway (70.2%, a difference of 0.020%), Immigrants from Lithuania (70.3%, a difference of 0.070%), Immigrants from Kuwait (70.3%, a difference of 0.11%), and Immigrants from Latvia (70.1%, a difference of 0.14%).
| Demographics | Rating | Rank | College, Under 1 year |
| Immigrants | Sri Lanka | 99.9 /100 | #36 | Exceptional 70.5% |
| Immigrants | Saudi Arabia | 99.9 /100 | #37 | Exceptional 70.4% |
| Australians | 99.9 /100 | #38 | Exceptional 70.4% |
| Bhutanese | 99.9 /100 | #39 | Exceptional 70.3% |
| Immigrants | Turkey | 99.9 /100 | #40 | Exceptional 70.3% |
| Immigrants | Kuwait | 99.9 /100 | #41 | Exceptional 70.3% |
| Immigrants | Lithuania | 99.9 /100 | #42 | Exceptional 70.3% |
| Israelis | 99.9 /100 | #43 | Exceptional 70.2% |
| New Zealanders | 99.9 /100 | #44 | Exceptional 70.2% |
| Immigrants | Norway | 99.9 /100 | #45 | Exceptional 70.2% |
| Immigrants | Latvia | 99.9 /100 | #46 | Exceptional 70.1% |
| Immigrants | Bulgaria | 99.8 /100 | #47 | Exceptional 70.0% |
| Immigrants | Netherlands | 99.8 /100 | #48 | Exceptional 70.0% |
| Immigrants | Austria | 99.8 /100 | #49 | Exceptional 70.0% |
| Zimbabweans | 99.8 /100 | #50 | Exceptional 69.9% |