Spanish American Indian vs Slovak College, Under 1 year
COMPARE
Spanish American Indian
Slovak
College, Under 1 year
College, Under 1 year Comparison
Spanish American Indians
Slovaks
54.0%
COLLEGE, UNDER 1 YEAR
0.0/ 100
METRIC RATING
340th/ 347
METRIC RANK
64.7%
COLLEGE, UNDER 1 YEAR
26.7/ 100
METRIC RATING
193rd/ 347
METRIC RANK
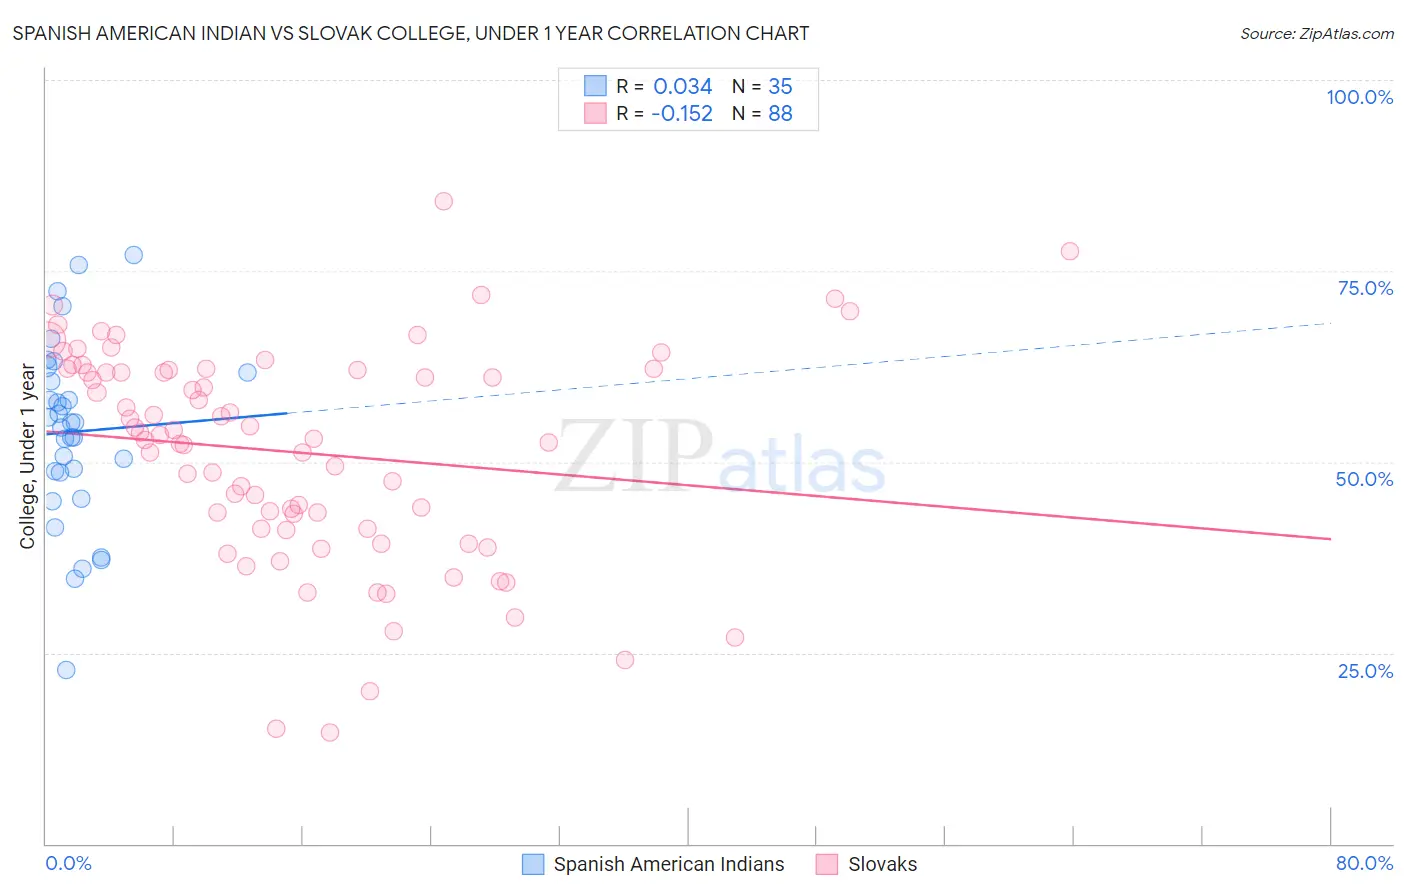
Spanish American Indian vs Slovak College, Under 1 year Correlation Chart
The statistical analysis conducted on geographies consisting of 73,150,359 people shows no correlation between the proportion of Spanish American Indians and percentage of population with at least college, under 1 year education in the United States with a correlation coefficient (R) of 0.034 and weighted average of 54.0%. Similarly, the statistical analysis conducted on geographies consisting of 397,891,856 people shows a poor negative correlation between the proportion of Slovaks and percentage of population with at least college, under 1 year education in the United States with a correlation coefficient (R) of -0.152 and weighted average of 64.7%, a difference of 19.9%.
College, Under 1 year Correlation Summary
| Measurement | Spanish American Indian | Slovak |
| Minimum | 22.8% | 14.5% |
| Maximum | 77.0% | 84.1% |
| Range | 54.2% | 69.5% |
| Mean | 53.9% | 51.3% |
| Median | 55.2% | 53.3% |
| Interquartile 25% (IQ1) | 48.7% | 41.2% |
| Interquartile 75% (IQ3) | 61.8% | 62.0% |
| Interquartile Range (IQR) | 13.1% | 20.8% |
| Standard Deviation (Sample) | 11.9% | 14.1% |
| Standard Deviation (Population) | 11.7% | 14.0% |
Similar Demographics by College, Under 1 year
Demographics Similar to Spanish American Indians by College, Under 1 year
In terms of college, under 1 year, the demographic groups most similar to Spanish American Indians are Immigrants from Dominican Republic (54.0%, a difference of 0.090%), Lumbee (54.2%, a difference of 0.49%), Immigrants from Cabo Verde (53.7%, a difference of 0.51%), Immigrants from Mexico (53.7%, a difference of 0.57%), and Immigrants from Central America (54.4%, a difference of 0.90%).
| Demographics | Rating | Rank | College, Under 1 year |
| Yuman | 0.0 /100 | #333 | Tragic 55.1% |
| Immigrants | Azores | 0.0 /100 | #334 | Tragic 54.7% |
| Inupiat | 0.0 /100 | #335 | Tragic 54.6% |
| Pennsylvania Germans | 0.0 /100 | #336 | Tragic 54.5% |
| Immigrants | Central America | 0.0 /100 | #337 | Tragic 54.4% |
| Lumbee | 0.0 /100 | #338 | Tragic 54.2% |
| Immigrants | Dominican Republic | 0.0 /100 | #339 | Tragic 54.0% |
| Spanish American Indians | 0.0 /100 | #340 | Tragic 54.0% |
| Immigrants | Cabo Verde | 0.0 /100 | #341 | Tragic 53.7% |
| Immigrants | Mexico | 0.0 /100 | #342 | Tragic 53.7% |
| Tohono O'odham | 0.0 /100 | #343 | Tragic 52.8% |
| Yakama | 0.0 /100 | #344 | Tragic 52.6% |
| Pima | 0.0 /100 | #345 | Tragic 51.4% |
| Houma | 0.0 /100 | #346 | Tragic 47.6% |
| Yup'ik | 0.0 /100 | #347 | Tragic 45.8% |
Demographics Similar to Slovaks by College, Under 1 year
In terms of college, under 1 year, the demographic groups most similar to Slovaks are Immigrants from Thailand (64.7%, a difference of 0.020%), Immigrants from Armenia (64.7%, a difference of 0.070%), Immigrants from Cameroon (64.6%, a difference of 0.13%), Immigrants from Philippines (64.8%, a difference of 0.19%), and Spanish (64.9%, a difference of 0.26%).
| Demographics | Rating | Rank | College, Under 1 year |
| Immigrants | Sierra Leone | 39.7 /100 | #186 | Fair 65.1% |
| Immigrants | Southern Europe | 34.3 /100 | #187 | Fair 64.9% |
| Immigrants | Albania | 32.0 /100 | #188 | Fair 64.9% |
| Spanish | 31.6 /100 | #189 | Fair 64.9% |
| Immigrants | Philippines | 30.1 /100 | #190 | Fair 64.8% |
| Immigrants | Armenia | 28.1 /100 | #191 | Fair 64.7% |
| Immigrants | Thailand | 27.0 /100 | #192 | Fair 64.7% |
| Slovaks | 26.7 /100 | #193 | Fair 64.7% |
| Immigrants | Cameroon | 24.6 /100 | #194 | Fair 64.6% |
| Immigrants | South Eastern Asia | 22.1 /100 | #195 | Fair 64.5% |
| Tongans | 21.2 /100 | #196 | Fair 64.5% |
| Costa Ricans | 19.6 /100 | #197 | Poor 64.4% |
| Tsimshian | 17.9 /100 | #198 | Poor 64.3% |
| Panamanians | 17.0 /100 | #199 | Poor 64.3% |
| Nigerians | 16.7 /100 | #200 | Poor 64.3% |