Indian (Asian) vs Immigrants from Switzerland College, Under 1 year
COMPARE
Indian (Asian)
Immigrants from Switzerland
College, Under 1 year
College, Under 1 year Comparison
Indians (Asian)
Immigrants from Switzerland
70.8%
COLLEGE, UNDER 1 YEAR
99.9/ 100
METRIC RATING
31st/ 347
METRIC RANK
71.7%
COLLEGE, UNDER 1 YEAR
100.0/ 100
METRIC RATING
18th/ 347
METRIC RANK
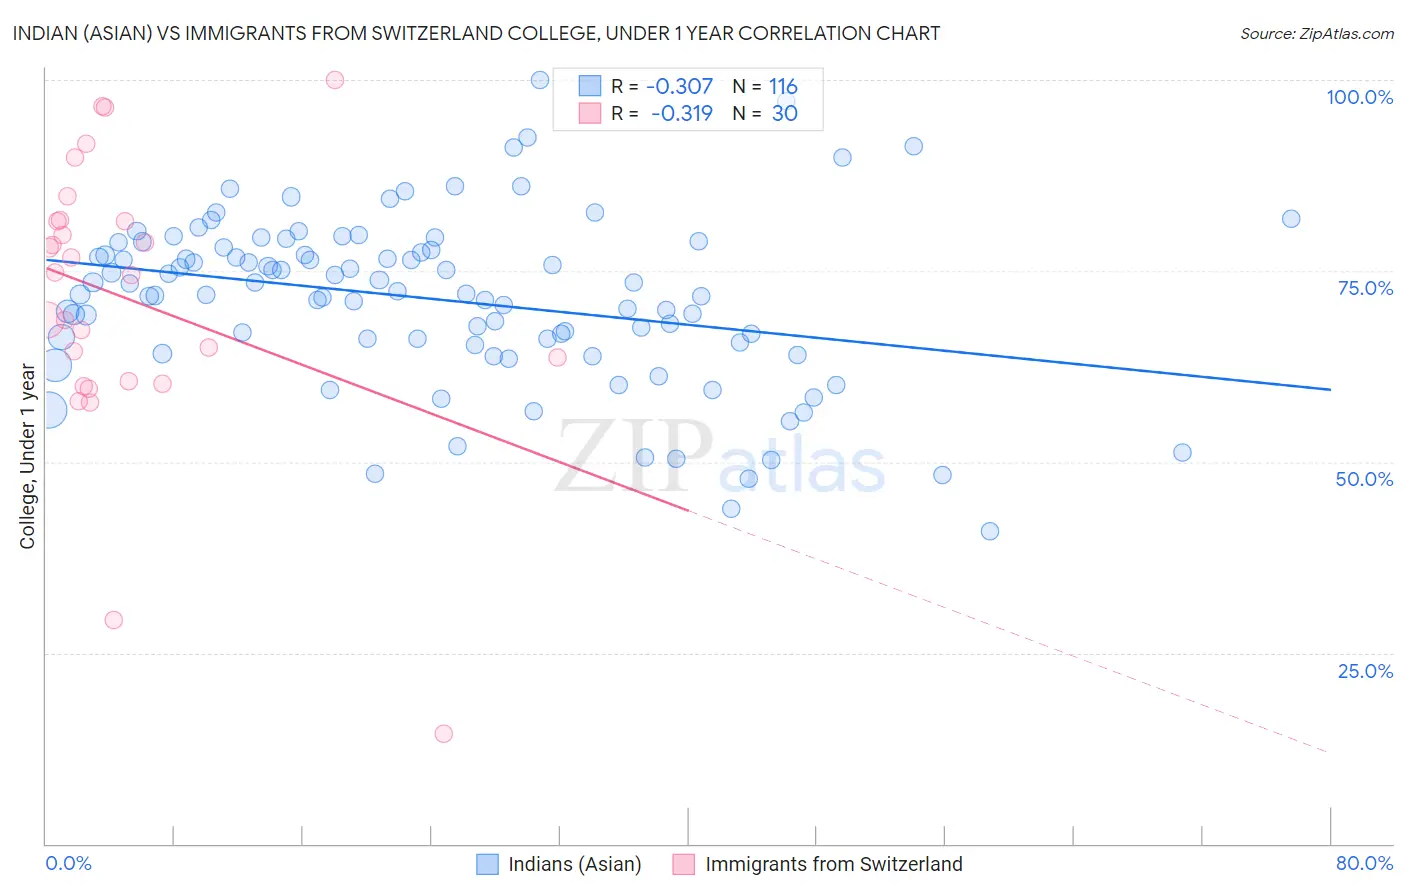
Indian (Asian) vs Immigrants from Switzerland College, Under 1 year Correlation Chart
The statistical analysis conducted on geographies consisting of 495,343,184 people shows a mild negative correlation between the proportion of Indians (Asian) and percentage of population with at least college, under 1 year education in the United States with a correlation coefficient (R) of -0.307 and weighted average of 70.8%. Similarly, the statistical analysis conducted on geographies consisting of 148,083,583 people shows a mild negative correlation between the proportion of Immigrants from Switzerland and percentage of population with at least college, under 1 year education in the United States with a correlation coefficient (R) of -0.319 and weighted average of 71.7%, a difference of 1.3%.
College, Under 1 year Correlation Summary
| Measurement | Indian (Asian) | Immigrants from Switzerland |
| Minimum | 40.9% | 14.4% |
| Maximum | 100.0% | 100.0% |
| Range | 59.1% | 85.6% |
| Mean | 71.3% | 71.4% |
| Median | 72.2% | 74.6% |
| Interquartile 25% (IQ1) | 65.9% | 60.6% |
| Interquartile 75% (IQ3) | 77.9% | 81.5% |
| Interquartile Range (IQR) | 12.0% | 20.9% |
| Standard Deviation (Sample) | 11.1% | 18.2% |
| Standard Deviation (Population) | 11.0% | 17.9% |
Demographics Similar to Indians (Asian) and Immigrants from Switzerland by College, Under 1 year
In terms of college, under 1 year, the demographic groups most similar to Indians (Asian) are Turkish (70.7%, a difference of 0.080%), Immigrants from China (70.9%, a difference of 0.11%), Immigrants from South Africa (70.6%, a difference of 0.25%), Estonian (70.6%, a difference of 0.27%), and Immigrants from Hong Kong (71.0%, a difference of 0.29%). Similarly, the demographic groups most similar to Immigrants from Switzerland are Latvian (71.6%, a difference of 0.11%), Eastern European (71.8%, a difference of 0.13%), Immigrants from Korea (71.6%, a difference of 0.15%), Immigrants from Japan (71.9%, a difference of 0.28%), and Cambodian (71.9%, a difference of 0.29%).
| Demographics | Rating | Rank | College, Under 1 year |
| Cambodians | 100.0 /100 | #14 | Exceptional 71.9% |
| Burmese | 100.0 /100 | #15 | Exceptional 71.9% |
| Immigrants | Japan | 100.0 /100 | #16 | Exceptional 71.9% |
| Eastern Europeans | 100.0 /100 | #17 | Exceptional 71.8% |
| Immigrants | Switzerland | 100.0 /100 | #18 | Exceptional 71.7% |
| Latvians | 100.0 /100 | #19 | Exceptional 71.6% |
| Immigrants | Korea | 100.0 /100 | #20 | Exceptional 71.6% |
| Immigrants | Belgium | 100.0 /100 | #21 | Exceptional 71.5% |
| Immigrants | Eastern Asia | 100.0 /100 | #22 | Exceptional 71.3% |
| Immigrants | Northern Europe | 100.0 /100 | #23 | Exceptional 71.1% |
| Soviet Union | 100.0 /100 | #24 | Exceptional 71.1% |
| Bulgarians | 100.0 /100 | #25 | Exceptional 71.1% |
| Immigrants | Denmark | 100.0 /100 | #26 | Exceptional 71.0% |
| Immigrants | Ireland | 100.0 /100 | #27 | Exceptional 71.0% |
| Immigrants | Hong Kong | 100.0 /100 | #28 | Exceptional 71.0% |
| Immigrants | France | 100.0 /100 | #29 | Exceptional 71.0% |
| Immigrants | China | 99.9 /100 | #30 | Exceptional 70.9% |
| Indians (Asian) | 99.9 /100 | #31 | Exceptional 70.8% |
| Turks | 99.9 /100 | #32 | Exceptional 70.7% |
| Immigrants | South Africa | 99.9 /100 | #33 | Exceptional 70.6% |
| Estonians | 99.9 /100 | #34 | Exceptional 70.6% |