Immigrants from Belize vs Immigrants from Switzerland College, Under 1 year
COMPARE
Immigrants from Belize
Immigrants from Switzerland
College, Under 1 year
College, Under 1 year Comparison
Immigrants from Belize
Immigrants from Switzerland
59.1%
COLLEGE, UNDER 1 YEAR
0.0/ 100
METRIC RATING
294th/ 347
METRIC RANK
71.7%
COLLEGE, UNDER 1 YEAR
100.0/ 100
METRIC RATING
18th/ 347
METRIC RANK
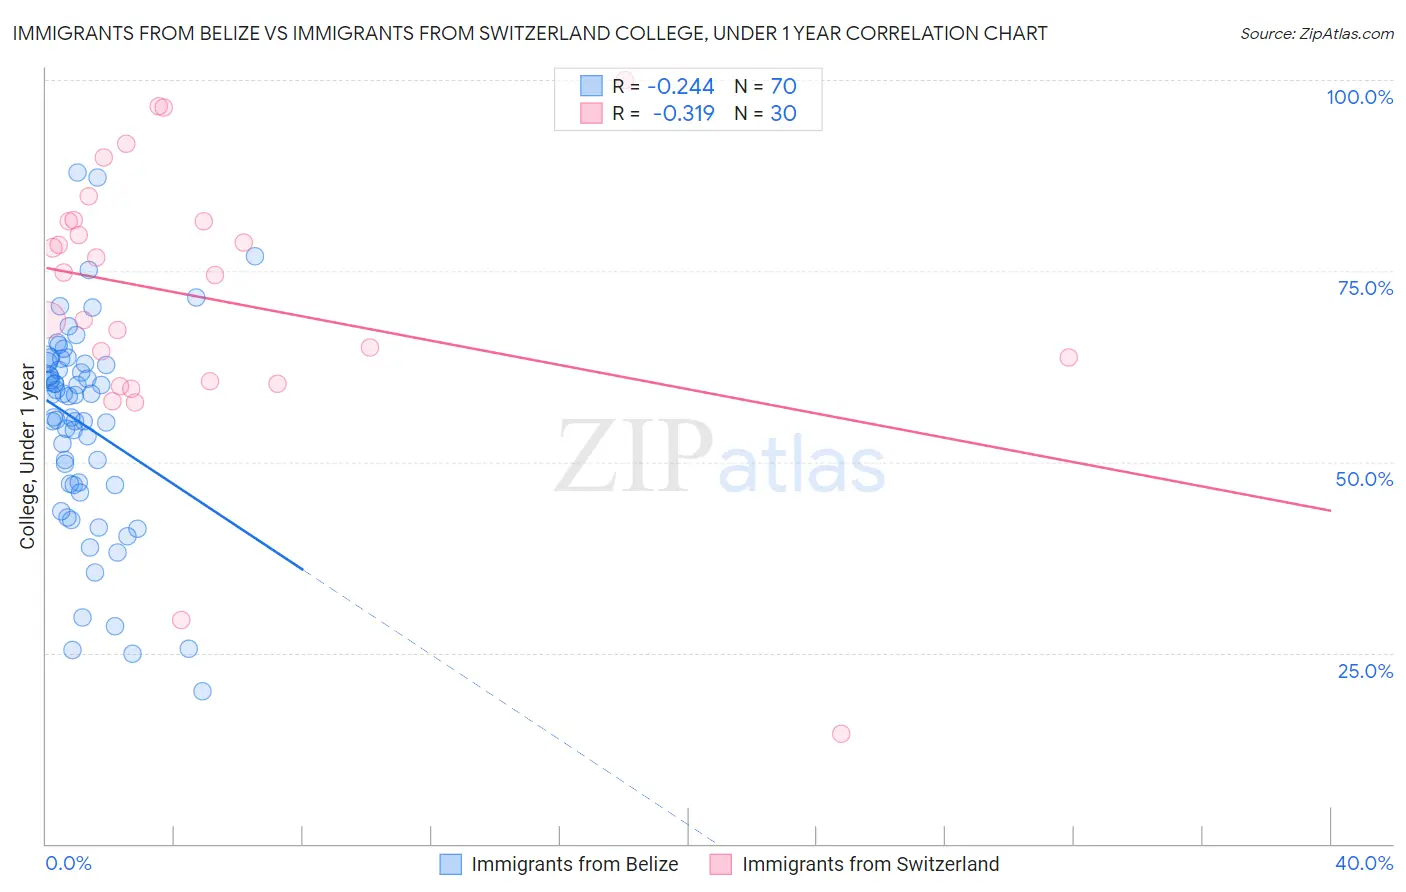
Immigrants from Belize vs Immigrants from Switzerland College, Under 1 year Correlation Chart
The statistical analysis conducted on geographies consisting of 130,329,081 people shows a weak negative correlation between the proportion of Immigrants from Belize and percentage of population with at least college, under 1 year education in the United States with a correlation coefficient (R) of -0.244 and weighted average of 59.1%. Similarly, the statistical analysis conducted on geographies consisting of 148,083,583 people shows a mild negative correlation between the proportion of Immigrants from Switzerland and percentage of population with at least college, under 1 year education in the United States with a correlation coefficient (R) of -0.319 and weighted average of 71.7%, a difference of 21.2%.
College, Under 1 year Correlation Summary
| Measurement | Immigrants from Belize | Immigrants from Switzerland |
| Minimum | 19.9% | 14.4% |
| Maximum | 87.9% | 100.0% |
| Range | 68.0% | 85.6% |
| Mean | 54.9% | 71.4% |
| Median | 58.7% | 74.6% |
| Interquartile 25% (IQ1) | 47.0% | 60.6% |
| Interquartile 75% (IQ3) | 62.9% | 81.5% |
| Interquartile Range (IQR) | 15.9% | 20.9% |
| Standard Deviation (Sample) | 13.7% | 18.2% |
| Standard Deviation (Population) | 13.6% | 17.9% |
Similar Demographics by College, Under 1 year
Demographics Similar to Immigrants from Belize by College, Under 1 year
In terms of college, under 1 year, the demographic groups most similar to Immigrants from Belize are Seminole (59.1%, a difference of 0.020%), Immigrants from Grenada (59.1%, a difference of 0.10%), Central American Indian (59.0%, a difference of 0.14%), Guyanese (59.0%, a difference of 0.19%), and Nicaraguan (59.2%, a difference of 0.20%).
| Demographics | Rating | Rank | College, Under 1 year |
| Sioux | 0.0 /100 | #287 | Tragic 59.4% |
| Blacks/African Americans | 0.0 /100 | #288 | Tragic 59.4% |
| Choctaw | 0.0 /100 | #289 | Tragic 59.3% |
| Ecuadorians | 0.0 /100 | #290 | Tragic 59.3% |
| Creek | 0.0 /100 | #291 | Tragic 59.3% |
| Nicaraguans | 0.0 /100 | #292 | Tragic 59.2% |
| Seminole | 0.0 /100 | #293 | Tragic 59.1% |
| Immigrants | Belize | 0.0 /100 | #294 | Tragic 59.1% |
| Immigrants | Grenada | 0.0 /100 | #295 | Tragic 59.1% |
| Central American Indians | 0.0 /100 | #296 | Tragic 59.0% |
| Guyanese | 0.0 /100 | #297 | Tragic 59.0% |
| Immigrants | Ecuador | 0.0 /100 | #298 | Tragic 58.7% |
| Cubans | 0.0 /100 | #299 | Tragic 58.6% |
| Immigrants | Guyana | 0.0 /100 | #300 | Tragic 58.5% |
| Mexican American Indians | 0.0 /100 | #301 | Tragic 58.1% |
Demographics Similar to Immigrants from Switzerland by College, Under 1 year
In terms of college, under 1 year, the demographic groups most similar to Immigrants from Switzerland are Latvian (71.6%, a difference of 0.11%), Eastern European (71.8%, a difference of 0.13%), Immigrants from Korea (71.6%, a difference of 0.15%), Immigrants from Japan (71.9%, a difference of 0.28%), and Cambodian (71.9%, a difference of 0.29%).
| Demographics | Rating | Rank | College, Under 1 year |
| Immigrants | South Central Asia | 100.0 /100 | #11 | Exceptional 72.1% |
| Immigrants | Sweden | 100.0 /100 | #12 | Exceptional 72.1% |
| Cypriots | 100.0 /100 | #13 | Exceptional 72.0% |
| Cambodians | 100.0 /100 | #14 | Exceptional 71.9% |
| Burmese | 100.0 /100 | #15 | Exceptional 71.9% |
| Immigrants | Japan | 100.0 /100 | #16 | Exceptional 71.9% |
| Eastern Europeans | 100.0 /100 | #17 | Exceptional 71.8% |
| Immigrants | Switzerland | 100.0 /100 | #18 | Exceptional 71.7% |
| Latvians | 100.0 /100 | #19 | Exceptional 71.6% |
| Immigrants | Korea | 100.0 /100 | #20 | Exceptional 71.6% |
| Immigrants | Belgium | 100.0 /100 | #21 | Exceptional 71.5% |
| Immigrants | Eastern Asia | 100.0 /100 | #22 | Exceptional 71.3% |
| Immigrants | Northern Europe | 100.0 /100 | #23 | Exceptional 71.1% |
| Soviet Union | 100.0 /100 | #24 | Exceptional 71.1% |
| Bulgarians | 100.0 /100 | #25 | Exceptional 71.1% |