Spaniard vs Immigrants from Jordan Master's Degree
COMPARE
Spaniard
Immigrants from Jordan
Master's Degree
Master's Degree Comparison
Spaniards
Immigrants from Jordan
14.6%
MASTER'S DEGREE
35.8/ 100
METRIC RATING
190th/ 347
METRIC RANK
16.1%
MASTER'S DEGREE
92.7/ 100
METRIC RATING
130th/ 347
METRIC RANK
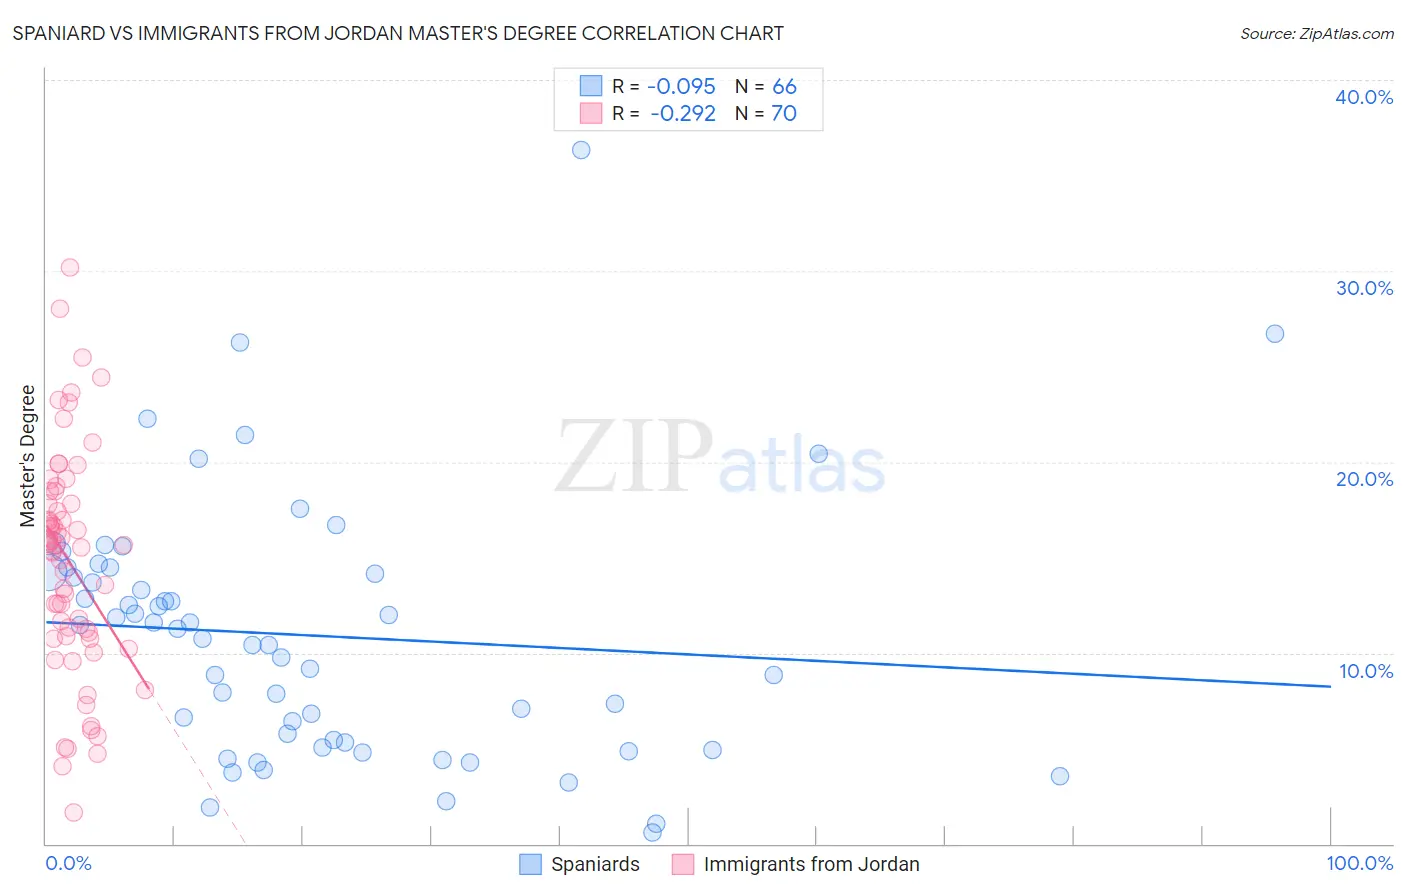
Spaniard vs Immigrants from Jordan Master's Degree Correlation Chart
The statistical analysis conducted on geographies consisting of 443,325,255 people shows a slight negative correlation between the proportion of Spaniards and percentage of population with at least master's degree education in the United States with a correlation coefficient (R) of -0.095 and weighted average of 14.6%. Similarly, the statistical analysis conducted on geographies consisting of 181,260,890 people shows a weak negative correlation between the proportion of Immigrants from Jordan and percentage of population with at least master's degree education in the United States with a correlation coefficient (R) of -0.292 and weighted average of 16.1%, a difference of 10.2%.
Master's Degree Correlation Summary
| Measurement | Spaniard | Immigrants from Jordan |
| Minimum | 0.56% | 1.6% |
| Maximum | 36.4% | 30.2% |
| Range | 35.8% | 28.6% |
| Mean | 10.9% | 14.7% |
| Median | 11.0% | 15.6% |
| Interquartile 25% (IQ1) | 5.3% | 10.9% |
| Interquartile 75% (IQ3) | 14.2% | 17.8% |
| Interquartile Range (IQR) | 8.9% | 6.9% |
| Standard Deviation (Sample) | 6.7% | 5.8% |
| Standard Deviation (Population) | 6.6% | 5.8% |
Similar Demographics by Master's Degree
Demographics Similar to Spaniards by Master's Degree
In terms of master's degree, the demographic groups most similar to Spaniards are Immigrants (14.6%, a difference of 0.020%), Immigrants from Costa Rica (14.7%, a difference of 0.060%), Basque (14.7%, a difference of 0.10%), Immigrants from Oceania (14.7%, a difference of 0.19%), and Welsh (14.6%, a difference of 0.23%).
| Demographics | Rating | Rank | Master's Degree |
| Sri Lankans | 39.6 /100 | #183 | Fair 14.7% |
| Immigrants | Zaire | 39.5 /100 | #184 | Fair 14.7% |
| Barbadians | 38.3 /100 | #185 | Fair 14.7% |
| Immigrants | Oceania | 37.1 /100 | #186 | Fair 14.7% |
| Basques | 36.5 /100 | #187 | Fair 14.7% |
| Immigrants | Costa Rica | 36.2 /100 | #188 | Fair 14.7% |
| Immigrants | Immigrants | 36.0 /100 | #189 | Fair 14.6% |
| Spaniards | 35.8 /100 | #190 | Fair 14.6% |
| Welsh | 34.2 /100 | #191 | Fair 14.6% |
| Immigrants | Middle Africa | 33.6 /100 | #192 | Fair 14.6% |
| Immigrants | Nigeria | 32.7 /100 | #193 | Fair 14.6% |
| Chinese | 32.5 /100 | #194 | Fair 14.6% |
| Danes | 31.3 /100 | #195 | Fair 14.5% |
| Czechoslovakians | 29.9 /100 | #196 | Fair 14.5% |
| Belgians | 28.0 /100 | #197 | Fair 14.5% |
Demographics Similar to Immigrants from Jordan by Master's Degree
In terms of master's degree, the demographic groups most similar to Immigrants from Jordan are Immigrants from Syria (16.2%, a difference of 0.26%), Taiwanese (16.1%, a difference of 0.32%), Serbian (16.1%, a difference of 0.41%), Immigrants from Sudan (16.0%, a difference of 0.95%), and Immigrants from Sierra Leone (16.3%, a difference of 1.0%).
| Demographics | Rating | Rank | Master's Degree |
| Croatians | 95.6 /100 | #123 | Exceptional 16.4% |
| Immigrants | Eritrea | 95.5 /100 | #124 | Exceptional 16.4% |
| Italians | 95.4 /100 | #125 | Exceptional 16.4% |
| Immigrants | Eastern Africa | 95.2 /100 | #126 | Exceptional 16.3% |
| Palestinians | 94.8 /100 | #127 | Exceptional 16.3% |
| Immigrants | Sierra Leone | 94.7 /100 | #128 | Exceptional 16.3% |
| Immigrants | Syria | 93.3 /100 | #129 | Exceptional 16.2% |
| Immigrants | Jordan | 92.7 /100 | #130 | Exceptional 16.1% |
| Taiwanese | 91.9 /100 | #131 | Exceptional 16.1% |
| Serbians | 91.7 /100 | #132 | Exceptional 16.1% |
| Immigrants | Sudan | 90.2 /100 | #133 | Exceptional 16.0% |
| Venezuelans | 88.4 /100 | #134 | Excellent 15.9% |
| South American Indians | 88.4 /100 | #135 | Excellent 15.9% |
| Assyrians/Chaldeans/Syriacs | 86.8 /100 | #136 | Excellent 15.8% |
| Europeans | 86.4 /100 | #137 | Excellent 15.8% |