Spaniard vs Japanese Master's Degree
COMPARE
Spaniard
Japanese
Master's Degree
Master's Degree Comparison
Spaniards
Japanese
14.6%
MASTER'S DEGREE
35.8/ 100
METRIC RATING
190th/ 347
METRIC RANK
12.5%
MASTER'S DEGREE
0.6/ 100
METRIC RATING
259th/ 347
METRIC RANK
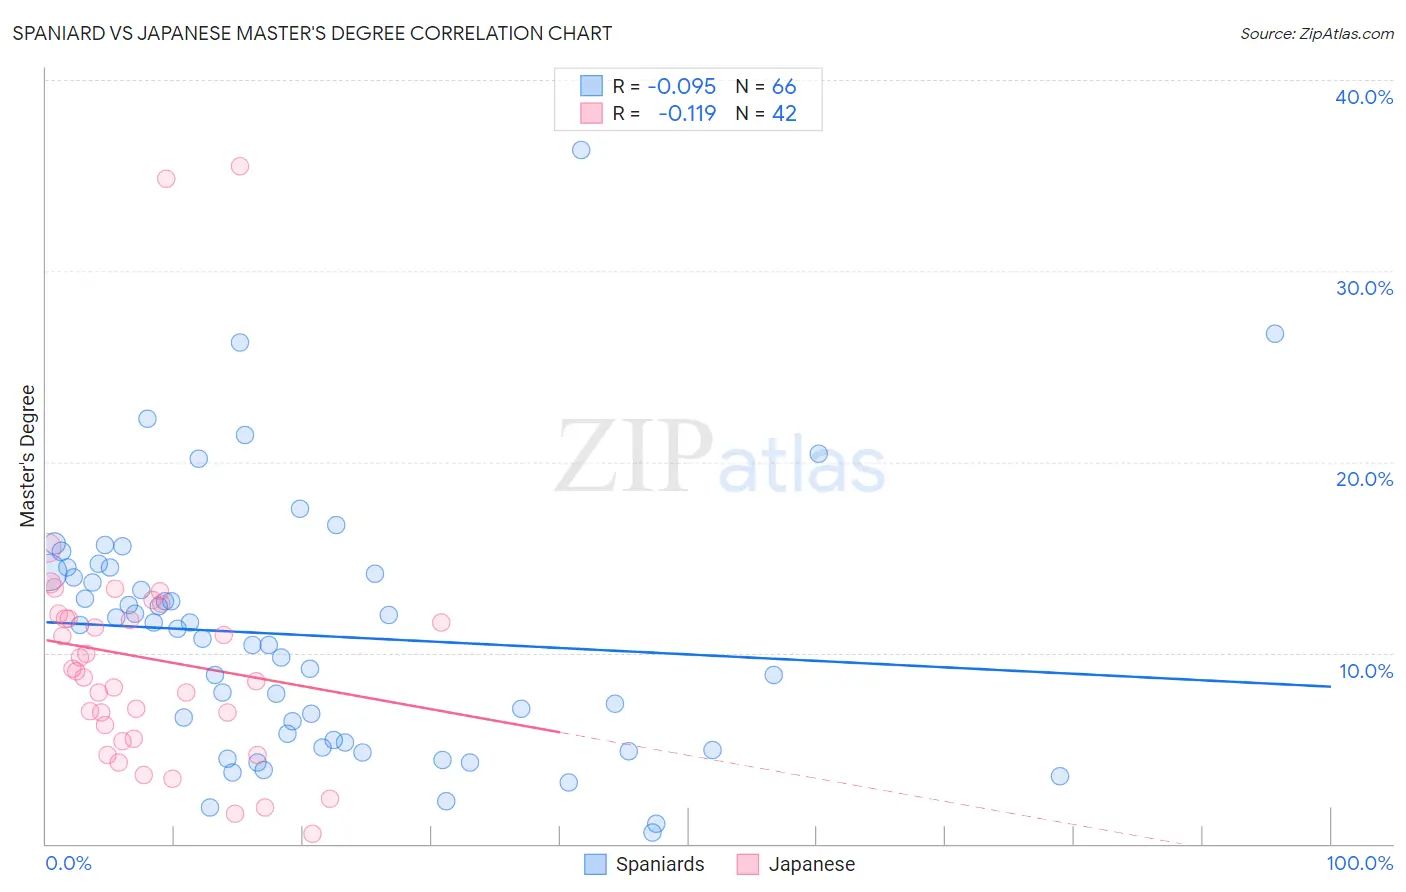
Spaniard vs Japanese Master's Degree Correlation Chart
The statistical analysis conducted on geographies consisting of 443,325,255 people shows a slight negative correlation between the proportion of Spaniards and percentage of population with at least master's degree education in the United States with a correlation coefficient (R) of -0.095 and weighted average of 14.6%. Similarly, the statistical analysis conducted on geographies consisting of 249,128,490 people shows a poor negative correlation between the proportion of Japanese and percentage of population with at least master's degree education in the United States with a correlation coefficient (R) of -0.119 and weighted average of 12.5%, a difference of 17.2%.
Master's Degree Correlation Summary
| Measurement | Spaniard | Japanese |
| Minimum | 0.56% | 0.51% |
| Maximum | 36.4% | 35.5% |
| Range | 35.8% | 35.0% |
| Mean | 10.9% | 9.7% |
| Median | 11.0% | 8.9% |
| Interquartile 25% (IQ1) | 5.3% | 5.5% |
| Interquartile 75% (IQ3) | 14.2% | 11.8% |
| Interquartile Range (IQR) | 8.9% | 6.3% |
| Standard Deviation (Sample) | 6.7% | 6.9% |
| Standard Deviation (Population) | 6.6% | 6.8% |
Similar Demographics by Master's Degree
Demographics Similar to Spaniards by Master's Degree
In terms of master's degree, the demographic groups most similar to Spaniards are Immigrants (14.6%, a difference of 0.020%), Immigrants from Costa Rica (14.7%, a difference of 0.060%), Basque (14.7%, a difference of 0.10%), Immigrants from Oceania (14.7%, a difference of 0.19%), and Welsh (14.6%, a difference of 0.23%).
| Demographics | Rating | Rank | Master's Degree |
| Sri Lankans | 39.6 /100 | #183 | Fair 14.7% |
| Immigrants | Zaire | 39.5 /100 | #184 | Fair 14.7% |
| Barbadians | 38.3 /100 | #185 | Fair 14.7% |
| Immigrants | Oceania | 37.1 /100 | #186 | Fair 14.7% |
| Basques | 36.5 /100 | #187 | Fair 14.7% |
| Immigrants | Costa Rica | 36.2 /100 | #188 | Fair 14.7% |
| Immigrants | Immigrants | 36.0 /100 | #189 | Fair 14.6% |
| Spaniards | 35.8 /100 | #190 | Fair 14.6% |
| Welsh | 34.2 /100 | #191 | Fair 14.6% |
| Immigrants | Middle Africa | 33.6 /100 | #192 | Fair 14.6% |
| Immigrants | Nigeria | 32.7 /100 | #193 | Fair 14.6% |
| Chinese | 32.5 /100 | #194 | Fair 14.6% |
| Danes | 31.3 /100 | #195 | Fair 14.5% |
| Czechoslovakians | 29.9 /100 | #196 | Fair 14.5% |
| Belgians | 28.0 /100 | #197 | Fair 14.5% |
Demographics Similar to Japanese by Master's Degree
In terms of master's degree, the demographic groups most similar to Japanese are Dominican (12.5%, a difference of 0.010%), Tongan (12.5%, a difference of 0.040%), Immigrants from Liberia (12.5%, a difference of 0.090%), Nicaraguan (12.5%, a difference of 0.23%), and Central American Indian (12.4%, a difference of 0.46%).
| Demographics | Rating | Rank | Master's Degree |
| French American Indians | 1.0 /100 | #252 | Tragic 12.7% |
| Immigrants | Dominica | 0.8 /100 | #253 | Tragic 12.6% |
| Indonesians | 0.8 /100 | #254 | Tragic 12.6% |
| Immigrants | Congo | 0.8 /100 | #255 | Tragic 12.6% |
| Immigrants | Portugal | 0.8 /100 | #256 | Tragic 12.6% |
| Osage | 0.7 /100 | #257 | Tragic 12.6% |
| Immigrants | Liberia | 0.6 /100 | #258 | Tragic 12.5% |
| Japanese | 0.6 /100 | #259 | Tragic 12.5% |
| Dominicans | 0.6 /100 | #260 | Tragic 12.5% |
| Tongans | 0.6 /100 | #261 | Tragic 12.5% |
| Nicaraguans | 0.6 /100 | #262 | Tragic 12.5% |
| Central American Indians | 0.5 /100 | #263 | Tragic 12.4% |
| Belizeans | 0.5 /100 | #264 | Tragic 12.4% |
| Immigrants | Fiji | 0.5 /100 | #265 | Tragic 12.4% |
| Bahamians | 0.5 /100 | #266 | Tragic 12.4% |