Ottawa vs Immigrants from Jordan Master's Degree
COMPARE
Ottawa
Immigrants from Jordan
Master's Degree
Master's Degree Comparison
Ottawa
Immigrants from Jordan
11.9%
MASTER'S DEGREE
0.2/ 100
METRIC RATING
284th/ 347
METRIC RANK
16.1%
MASTER'S DEGREE
92.7/ 100
METRIC RATING
130th/ 347
METRIC RANK
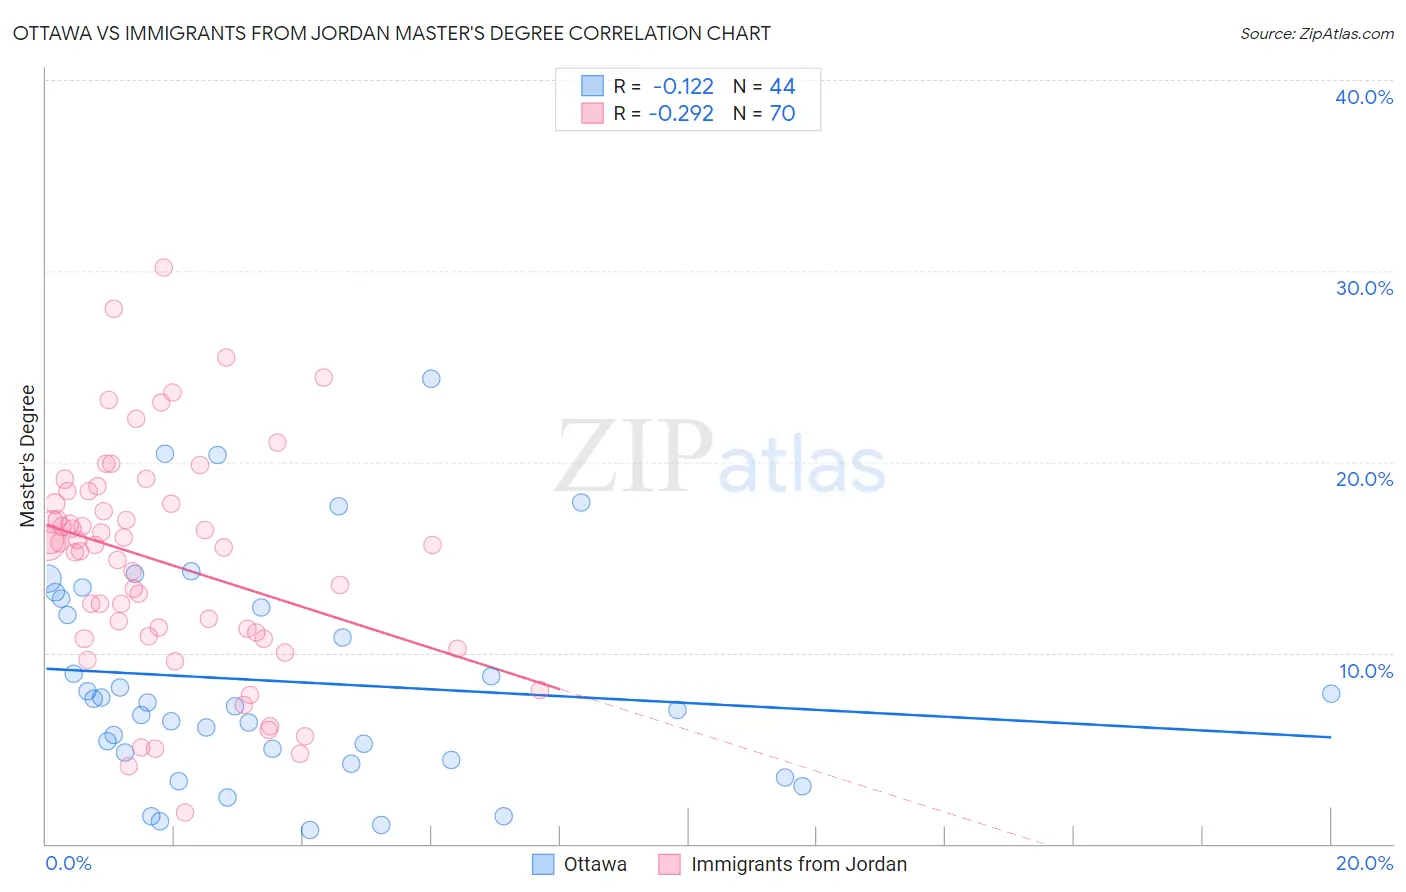
Ottawa vs Immigrants from Jordan Master's Degree Correlation Chart
The statistical analysis conducted on geographies consisting of 49,953,326 people shows a poor negative correlation between the proportion of Ottawa and percentage of population with at least master's degree education in the United States with a correlation coefficient (R) of -0.122 and weighted average of 11.9%. Similarly, the statistical analysis conducted on geographies consisting of 181,260,890 people shows a weak negative correlation between the proportion of Immigrants from Jordan and percentage of population with at least master's degree education in the United States with a correlation coefficient (R) of -0.292 and weighted average of 16.1%, a difference of 36.0%.
Master's Degree Correlation Summary
| Measurement | Ottawa | Immigrants from Jordan |
| Minimum | 0.69% | 1.6% |
| Maximum | 24.3% | 30.2% |
| Range | 23.6% | 28.6% |
| Mean | 8.5% | 14.7% |
| Median | 7.3% | 15.6% |
| Interquartile 25% (IQ1) | 4.6% | 10.9% |
| Interquartile 75% (IQ3) | 12.6% | 17.8% |
| Interquartile Range (IQR) | 8.0% | 6.9% |
| Standard Deviation (Sample) | 5.7% | 5.8% |
| Standard Deviation (Population) | 5.6% | 5.8% |
Similar Demographics by Master's Degree
Demographics Similar to Ottawa by Master's Degree
In terms of master's degree, the demographic groups most similar to Ottawa are Immigrants from Nicaragua (11.8%, a difference of 0.18%), Aleut (11.8%, a difference of 0.54%), Honduran (11.9%, a difference of 0.72%), Immigrants from Haiti (11.8%, a difference of 0.74%), and Immigrants from Honduras (11.8%, a difference of 0.90%).
| Demographics | Rating | Rank | Master's Degree |
| Immigrants | Caribbean | 0.3 /100 | #277 | Tragic 12.1% |
| Potawatomi | 0.3 /100 | #278 | Tragic 12.1% |
| Immigrants | Belize | 0.2 /100 | #279 | Tragic 12.1% |
| Immigrants | Dominican Republic | 0.2 /100 | #280 | Tragic 12.1% |
| Malaysians | 0.2 /100 | #281 | Tragic 12.0% |
| Immigrants | El Salvador | 0.2 /100 | #282 | Tragic 12.0% |
| Hondurans | 0.2 /100 | #283 | Tragic 11.9% |
| Ottawa | 0.2 /100 | #284 | Tragic 11.9% |
| Immigrants | Nicaragua | 0.2 /100 | #285 | Tragic 11.8% |
| Aleuts | 0.1 /100 | #286 | Tragic 11.8% |
| Immigrants | Haiti | 0.1 /100 | #287 | Tragic 11.8% |
| Immigrants | Honduras | 0.1 /100 | #288 | Tragic 11.8% |
| Guatemalans | 0.1 /100 | #289 | Tragic 11.7% |
| Ute | 0.1 /100 | #290 | Tragic 11.7% |
| Colville | 0.1 /100 | #291 | Tragic 11.6% |
Demographics Similar to Immigrants from Jordan by Master's Degree
In terms of master's degree, the demographic groups most similar to Immigrants from Jordan are Immigrants from Syria (16.2%, a difference of 0.26%), Taiwanese (16.1%, a difference of 0.32%), Serbian (16.1%, a difference of 0.41%), Immigrants from Sudan (16.0%, a difference of 0.95%), and Immigrants from Sierra Leone (16.3%, a difference of 1.0%).
| Demographics | Rating | Rank | Master's Degree |
| Croatians | 95.6 /100 | #123 | Exceptional 16.4% |
| Immigrants | Eritrea | 95.5 /100 | #124 | Exceptional 16.4% |
| Italians | 95.4 /100 | #125 | Exceptional 16.4% |
| Immigrants | Eastern Africa | 95.2 /100 | #126 | Exceptional 16.3% |
| Palestinians | 94.8 /100 | #127 | Exceptional 16.3% |
| Immigrants | Sierra Leone | 94.7 /100 | #128 | Exceptional 16.3% |
| Immigrants | Syria | 93.3 /100 | #129 | Exceptional 16.2% |
| Immigrants | Jordan | 92.7 /100 | #130 | Exceptional 16.1% |
| Taiwanese | 91.9 /100 | #131 | Exceptional 16.1% |
| Serbians | 91.7 /100 | #132 | Exceptional 16.1% |
| Immigrants | Sudan | 90.2 /100 | #133 | Exceptional 16.0% |
| Venezuelans | 88.4 /100 | #134 | Excellent 15.9% |
| South American Indians | 88.4 /100 | #135 | Excellent 15.9% |
| Assyrians/Chaldeans/Syriacs | 86.8 /100 | #136 | Excellent 15.8% |
| Europeans | 86.4 /100 | #137 | Excellent 15.8% |