Slavic vs Immigrants from Jordan Master's Degree
COMPARE
Slavic
Immigrants from Jordan
Master's Degree
Master's Degree Comparison
Slavs
Immigrants from Jordan
15.5%
MASTER'S DEGREE
77.0/ 100
METRIC RATING
152nd/ 347
METRIC RANK
16.1%
MASTER'S DEGREE
92.7/ 100
METRIC RATING
130th/ 347
METRIC RANK
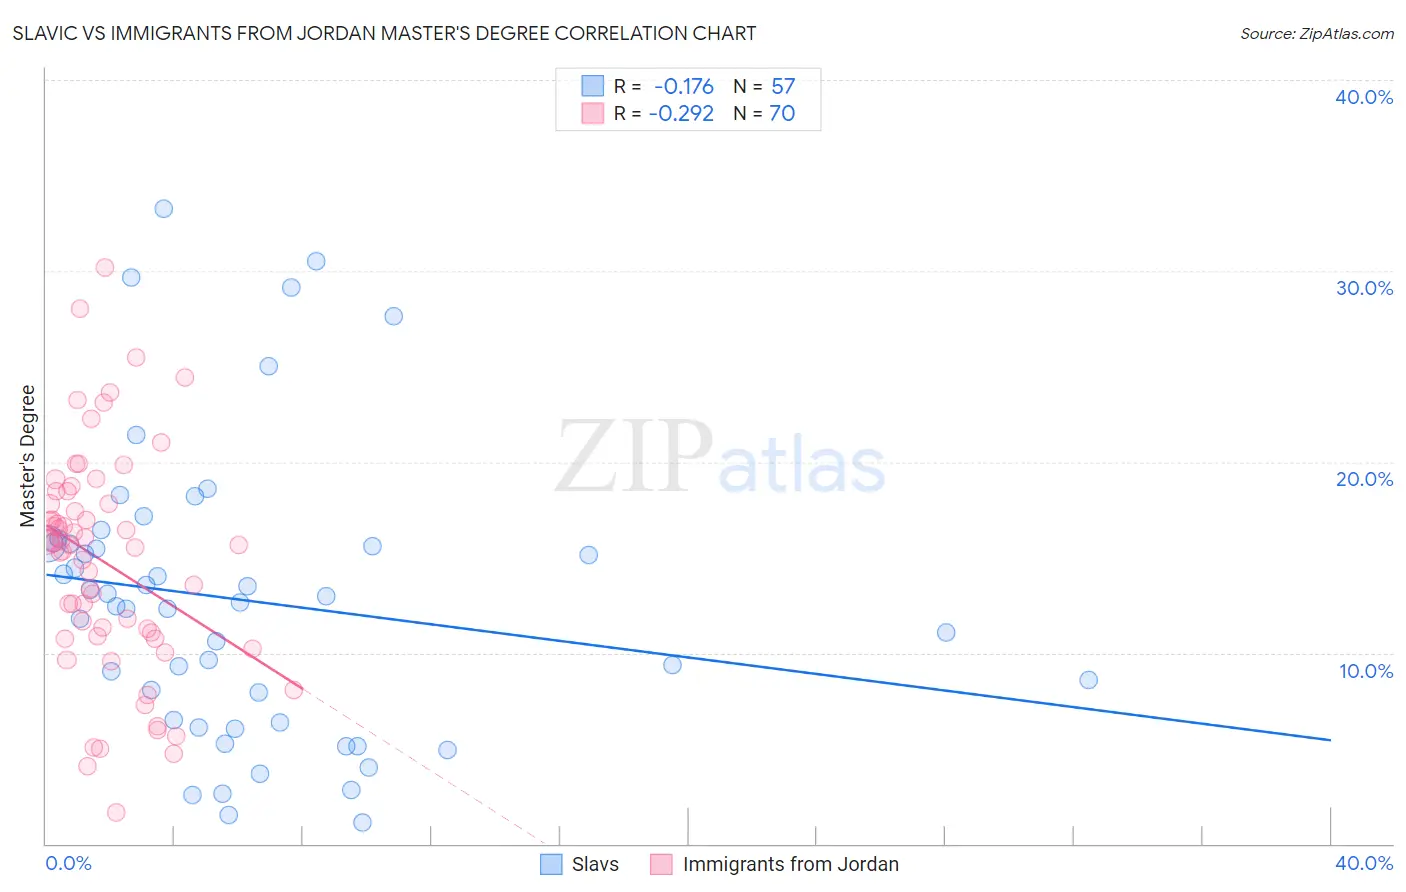
Slavic vs Immigrants from Jordan Master's Degree Correlation Chart
The statistical analysis conducted on geographies consisting of 270,833,952 people shows a poor negative correlation between the proportion of Slavs and percentage of population with at least master's degree education in the United States with a correlation coefficient (R) of -0.176 and weighted average of 15.5%. Similarly, the statistical analysis conducted on geographies consisting of 181,260,890 people shows a weak negative correlation between the proportion of Immigrants from Jordan and percentage of population with at least master's degree education in the United States with a correlation coefficient (R) of -0.292 and weighted average of 16.1%, a difference of 4.1%.
Master's Degree Correlation Summary
| Measurement | Slavic | Immigrants from Jordan |
| Minimum | 1.1% | 1.6% |
| Maximum | 33.2% | 30.2% |
| Range | 32.1% | 28.6% |
| Mean | 12.8% | 14.7% |
| Median | 12.6% | 15.6% |
| Interquartile 25% (IQ1) | 6.4% | 10.9% |
| Interquartile 75% (IQ3) | 15.7% | 17.8% |
| Interquartile Range (IQR) | 9.3% | 6.9% |
| Standard Deviation (Sample) | 7.5% | 5.8% |
| Standard Deviation (Population) | 7.5% | 5.8% |
Similar Demographics by Master's Degree
Demographics Similar to Slavs by Master's Degree
In terms of master's degree, the demographic groups most similar to Slavs are Icelander (15.5%, a difference of 0.030%), Iraqi (15.5%, a difference of 0.050%), Immigrants from South America (15.5%, a difference of 0.12%), Immigrants from Bangladesh (15.5%, a difference of 0.16%), and Slovene (15.5%, a difference of 0.17%).
| Demographics | Rating | Rank | Master's Degree |
| South Americans | 81.3 /100 | #145 | Excellent 15.6% |
| Immigrants | Afghanistan | 79.4 /100 | #146 | Good 15.6% |
| Hungarians | 79.1 /100 | #147 | Good 15.6% |
| Immigrants | Senegal | 78.2 /100 | #148 | Good 15.5% |
| Ghanaians | 78.2 /100 | #149 | Good 15.5% |
| Slovenes | 78.0 /100 | #150 | Good 15.5% |
| Iraqis | 77.3 /100 | #151 | Good 15.5% |
| Slavs | 77.0 /100 | #152 | Good 15.5% |
| Icelanders | 76.8 /100 | #153 | Good 15.5% |
| Immigrants | South America | 76.3 /100 | #154 | Good 15.5% |
| Immigrants | Bangladesh | 76.1 /100 | #155 | Good 15.5% |
| Bermudans | 73.9 /100 | #156 | Good 15.4% |
| Immigrants | Cameroon | 71.7 /100 | #157 | Good 15.4% |
| Immigrants | Poland | 71.5 /100 | #158 | Good 15.4% |
| Luxembourgers | 71.0 /100 | #159 | Good 15.3% |
Demographics Similar to Immigrants from Jordan by Master's Degree
In terms of master's degree, the demographic groups most similar to Immigrants from Jordan are Immigrants from Syria (16.2%, a difference of 0.26%), Taiwanese (16.1%, a difference of 0.32%), Serbian (16.1%, a difference of 0.41%), Immigrants from Sudan (16.0%, a difference of 0.95%), and Immigrants from Sierra Leone (16.3%, a difference of 1.0%).
| Demographics | Rating | Rank | Master's Degree |
| Croatians | 95.6 /100 | #123 | Exceptional 16.4% |
| Immigrants | Eritrea | 95.5 /100 | #124 | Exceptional 16.4% |
| Italians | 95.4 /100 | #125 | Exceptional 16.4% |
| Immigrants | Eastern Africa | 95.2 /100 | #126 | Exceptional 16.3% |
| Palestinians | 94.8 /100 | #127 | Exceptional 16.3% |
| Immigrants | Sierra Leone | 94.7 /100 | #128 | Exceptional 16.3% |
| Immigrants | Syria | 93.3 /100 | #129 | Exceptional 16.2% |
| Immigrants | Jordan | 92.7 /100 | #130 | Exceptional 16.1% |
| Taiwanese | 91.9 /100 | #131 | Exceptional 16.1% |
| Serbians | 91.7 /100 | #132 | Exceptional 16.1% |
| Immigrants | Sudan | 90.2 /100 | #133 | Exceptional 16.0% |
| Venezuelans | 88.4 /100 | #134 | Excellent 15.9% |
| South American Indians | 88.4 /100 | #135 | Excellent 15.9% |
| Assyrians/Chaldeans/Syriacs | 86.8 /100 | #136 | Excellent 15.8% |
| Europeans | 86.4 /100 | #137 | Excellent 15.8% |