Spaniard vs Canadian Master's Degree
COMPARE
Spaniard
Canadian
Master's Degree
Master's Degree Comparison
Spaniards
Canadians
14.6%
MASTER'S DEGREE
35.8/ 100
METRIC RATING
190th/ 347
METRIC RANK
15.7%
MASTER'S DEGREE
83.3/ 100
METRIC RATING
144th/ 347
METRIC RANK
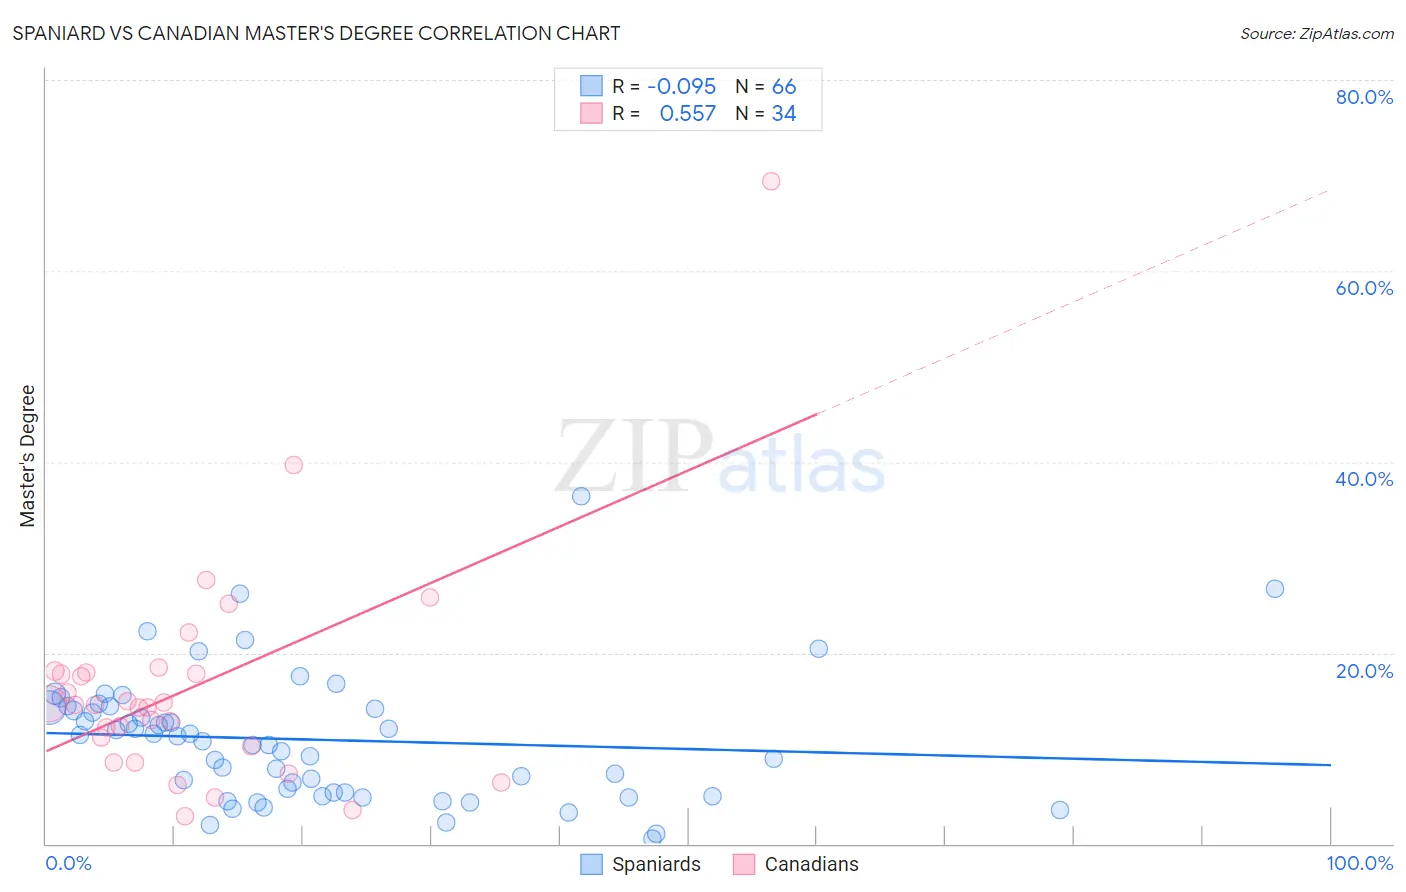
Spaniard vs Canadian Master's Degree Correlation Chart
The statistical analysis conducted on geographies consisting of 443,325,255 people shows a slight negative correlation between the proportion of Spaniards and percentage of population with at least master's degree education in the United States with a correlation coefficient (R) of -0.095 and weighted average of 14.6%. Similarly, the statistical analysis conducted on geographies consisting of 437,396,402 people shows a substantial positive correlation between the proportion of Canadians and percentage of population with at least master's degree education in the United States with a correlation coefficient (R) of 0.557 and weighted average of 15.7%, a difference of 7.1%.
Master's Degree Correlation Summary
| Measurement | Spaniard | Canadian |
| Minimum | 0.56% | 2.8% |
| Maximum | 36.4% | 69.4% |
| Range | 35.8% | 66.6% |
| Mean | 10.9% | 16.3% |
| Median | 11.0% | 14.6% |
| Interquartile 25% (IQ1) | 5.3% | 10.2% |
| Interquartile 75% (IQ3) | 14.2% | 18.0% |
| Interquartile Range (IQR) | 8.9% | 7.8% |
| Standard Deviation (Sample) | 6.7% | 12.0% |
| Standard Deviation (Population) | 6.6% | 11.8% |
Similar Demographics by Master's Degree
Demographics Similar to Spaniards by Master's Degree
In terms of master's degree, the demographic groups most similar to Spaniards are Immigrants (14.6%, a difference of 0.020%), Immigrants from Costa Rica (14.7%, a difference of 0.060%), Basque (14.7%, a difference of 0.10%), Immigrants from Oceania (14.7%, a difference of 0.19%), and Welsh (14.6%, a difference of 0.23%).
| Demographics | Rating | Rank | Master's Degree |
| Sri Lankans | 39.6 /100 | #183 | Fair 14.7% |
| Immigrants | Zaire | 39.5 /100 | #184 | Fair 14.7% |
| Barbadians | 38.3 /100 | #185 | Fair 14.7% |
| Immigrants | Oceania | 37.1 /100 | #186 | Fair 14.7% |
| Basques | 36.5 /100 | #187 | Fair 14.7% |
| Immigrants | Costa Rica | 36.2 /100 | #188 | Fair 14.7% |
| Immigrants | Immigrants | 36.0 /100 | #189 | Fair 14.6% |
| Spaniards | 35.8 /100 | #190 | Fair 14.6% |
| Welsh | 34.2 /100 | #191 | Fair 14.6% |
| Immigrants | Middle Africa | 33.6 /100 | #192 | Fair 14.6% |
| Immigrants | Nigeria | 32.7 /100 | #193 | Fair 14.6% |
| Chinese | 32.5 /100 | #194 | Fair 14.6% |
| Danes | 31.3 /100 | #195 | Fair 14.5% |
| Czechoslovakians | 29.9 /100 | #196 | Fair 14.5% |
| Belgians | 28.0 /100 | #197 | Fair 14.5% |
Demographics Similar to Canadians by Master's Degree
In terms of master's degree, the demographic groups most similar to Canadians are Immigrants from Venezuela (15.7%, a difference of 0.080%), Immigrants from Africa (15.7%, a difference of 0.17%), Polish (15.7%, a difference of 0.40%), South American (15.6%, a difference of 0.42%), and Vietnamese (15.8%, a difference of 0.53%).
| Demographics | Rating | Rank | Master's Degree |
| Europeans | 86.4 /100 | #137 | Excellent 15.8% |
| Pakistanis | 86.1 /100 | #138 | Excellent 15.8% |
| Immigrants | Germany | 85.9 /100 | #139 | Excellent 15.8% |
| Vietnamese | 85.5 /100 | #140 | Excellent 15.8% |
| Poles | 85.0 /100 | #141 | Excellent 15.7% |
| Immigrants | Africa | 84.0 /100 | #142 | Excellent 15.7% |
| Immigrants | Venezuela | 83.6 /100 | #143 | Excellent 15.7% |
| Canadians | 83.3 /100 | #144 | Excellent 15.7% |
| South Americans | 81.3 /100 | #145 | Excellent 15.6% |
| Immigrants | Afghanistan | 79.4 /100 | #146 | Good 15.6% |
| Hungarians | 79.1 /100 | #147 | Good 15.6% |
| Immigrants | Senegal | 78.2 /100 | #148 | Good 15.5% |
| Ghanaians | 78.2 /100 | #149 | Good 15.5% |
| Slovenes | 78.0 /100 | #150 | Good 15.5% |
| Iraqis | 77.3 /100 | #151 | Good 15.5% |