Spaniard vs Bermudan Master's Degree
COMPARE
Spaniard
Bermudan
Master's Degree
Master's Degree Comparison
Spaniards
Bermudans
14.6%
MASTER'S DEGREE
35.8/ 100
METRIC RATING
190th/ 347
METRIC RANK
15.4%
MASTER'S DEGREE
73.9/ 100
METRIC RATING
156th/ 347
METRIC RANK
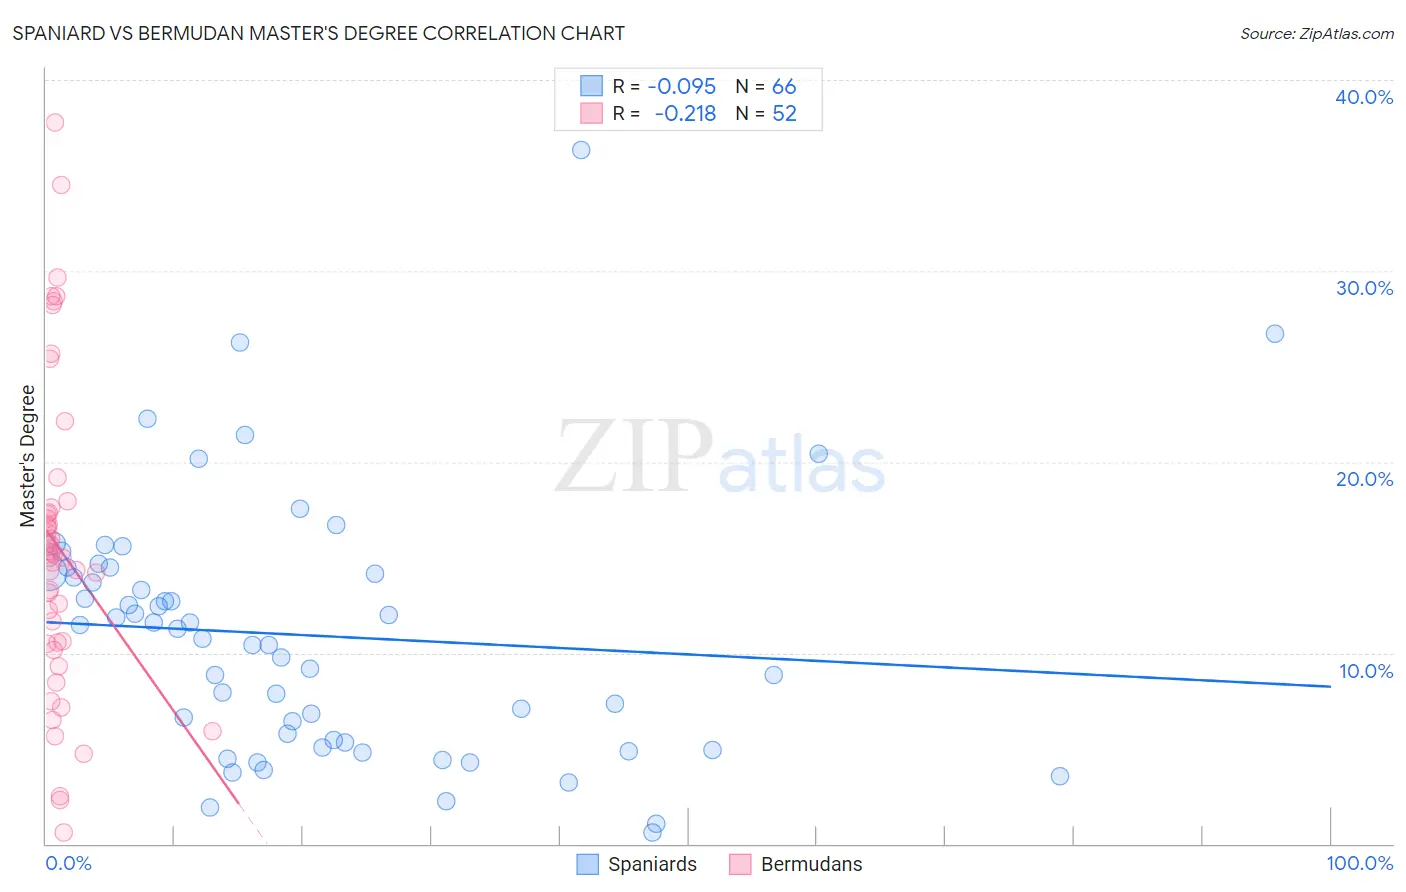
Spaniard vs Bermudan Master's Degree Correlation Chart
The statistical analysis conducted on geographies consisting of 443,325,255 people shows a slight negative correlation between the proportion of Spaniards and percentage of population with at least master's degree education in the United States with a correlation coefficient (R) of -0.095 and weighted average of 14.6%. Similarly, the statistical analysis conducted on geographies consisting of 55,727,694 people shows a weak negative correlation between the proportion of Bermudans and percentage of population with at least master's degree education in the United States with a correlation coefficient (R) of -0.218 and weighted average of 15.4%, a difference of 5.3%.
Master's Degree Correlation Summary
| Measurement | Spaniard | Bermudan |
| Minimum | 0.56% | 0.60% |
| Maximum | 36.4% | 37.8% |
| Range | 35.8% | 37.2% |
| Mean | 10.9% | 15.5% |
| Median | 11.0% | 15.1% |
| Interquartile 25% (IQ1) | 5.3% | 10.5% |
| Interquartile 75% (IQ3) | 14.2% | 17.5% |
| Interquartile Range (IQR) | 8.9% | 7.0% |
| Standard Deviation (Sample) | 6.7% | 8.1% |
| Standard Deviation (Population) | 6.6% | 8.0% |
Similar Demographics by Master's Degree
Demographics Similar to Spaniards by Master's Degree
In terms of master's degree, the demographic groups most similar to Spaniards are Immigrants (14.6%, a difference of 0.020%), Immigrants from Costa Rica (14.7%, a difference of 0.060%), Basque (14.7%, a difference of 0.10%), Immigrants from Oceania (14.7%, a difference of 0.19%), and Welsh (14.6%, a difference of 0.23%).
| Demographics | Rating | Rank | Master's Degree |
| Sri Lankans | 39.6 /100 | #183 | Fair 14.7% |
| Immigrants | Zaire | 39.5 /100 | #184 | Fair 14.7% |
| Barbadians | 38.3 /100 | #185 | Fair 14.7% |
| Immigrants | Oceania | 37.1 /100 | #186 | Fair 14.7% |
| Basques | 36.5 /100 | #187 | Fair 14.7% |
| Immigrants | Costa Rica | 36.2 /100 | #188 | Fair 14.7% |
| Immigrants | Immigrants | 36.0 /100 | #189 | Fair 14.6% |
| Spaniards | 35.8 /100 | #190 | Fair 14.6% |
| Welsh | 34.2 /100 | #191 | Fair 14.6% |
| Immigrants | Middle Africa | 33.6 /100 | #192 | Fair 14.6% |
| Immigrants | Nigeria | 32.7 /100 | #193 | Fair 14.6% |
| Chinese | 32.5 /100 | #194 | Fair 14.6% |
| Danes | 31.3 /100 | #195 | Fair 14.5% |
| Czechoslovakians | 29.9 /100 | #196 | Fair 14.5% |
| Belgians | 28.0 /100 | #197 | Fair 14.5% |
Demographics Similar to Bermudans by Master's Degree
In terms of master's degree, the demographic groups most similar to Bermudans are Immigrants from Cameroon (15.4%, a difference of 0.35%), Immigrants from Bangladesh (15.5%, a difference of 0.36%), Immigrants from Poland (15.4%, a difference of 0.39%), Immigrants from South America (15.5%, a difference of 0.40%), and Luxembourger (15.3%, a difference of 0.45%).
| Demographics | Rating | Rank | Master's Degree |
| Ghanaians | 78.2 /100 | #149 | Good 15.5% |
| Slovenes | 78.0 /100 | #150 | Good 15.5% |
| Iraqis | 77.3 /100 | #151 | Good 15.5% |
| Slavs | 77.0 /100 | #152 | Good 15.5% |
| Icelanders | 76.8 /100 | #153 | Good 15.5% |
| Immigrants | South America | 76.3 /100 | #154 | Good 15.5% |
| Immigrants | Bangladesh | 76.1 /100 | #155 | Good 15.5% |
| Bermudans | 73.9 /100 | #156 | Good 15.4% |
| Immigrants | Cameroon | 71.7 /100 | #157 | Good 15.4% |
| Immigrants | Poland | 71.5 /100 | #158 | Good 15.4% |
| Luxembourgers | 71.0 /100 | #159 | Good 15.3% |
| Kenyans | 70.3 /100 | #160 | Good 15.3% |
| Sudanese | 68.7 /100 | #161 | Good 15.3% |
| Peruvians | 68.7 /100 | #162 | Good 15.3% |
| Uruguayans | 67.1 /100 | #163 | Good 15.3% |