Spaniard vs Immigrants from Jordan Single Female Poverty
COMPARE
Spaniard
Immigrants from Jordan
Single Female Poverty
Single Female Poverty Comparison
Spaniards
Immigrants from Jordan
22.0%
SINGLE FEMALE POVERTY
4.7/ 100
METRIC RATING
233rd/ 347
METRIC RANK
19.3%
SINGLE FEMALE POVERTY
99.4/ 100
METRIC RATING
70th/ 347
METRIC RANK
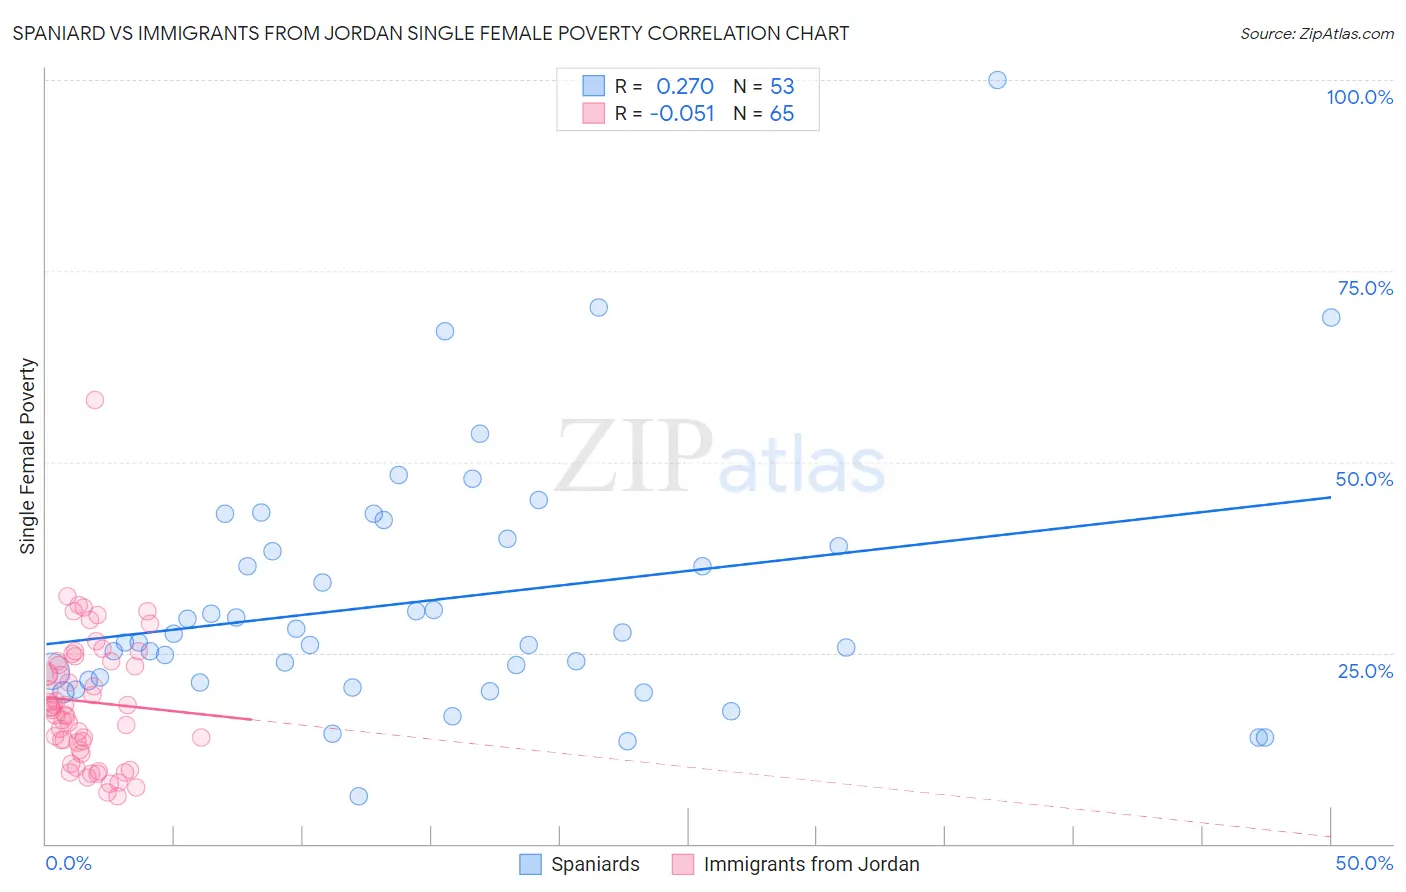
Spaniard vs Immigrants from Jordan Single Female Poverty Correlation Chart
The statistical analysis conducted on geographies consisting of 435,429,561 people shows a weak positive correlation between the proportion of Spaniards and poverty level among single females in the United States with a correlation coefficient (R) of 0.270 and weighted average of 22.0%. Similarly, the statistical analysis conducted on geographies consisting of 180,238,780 people shows a slight negative correlation between the proportion of Immigrants from Jordan and poverty level among single females in the United States with a correlation coefficient (R) of -0.051 and weighted average of 19.3%, a difference of 13.9%.
Single Female Poverty Correlation Summary
| Measurement | Spaniard | Immigrants from Jordan |
| Minimum | 6.3% | 6.2% |
| Maximum | 100.0% | 58.2% |
| Range | 93.7% | 51.9% |
| Mean | 31.9% | 18.6% |
| Median | 26.3% | 17.8% |
| Interquartile 25% (IQ1) | 21.2% | 12.8% |
| Interquartile 75% (IQ3) | 39.4% | 23.9% |
| Interquartile Range (IQR) | 18.2% | 11.1% |
| Standard Deviation (Sample) | 16.8% | 8.7% |
| Standard Deviation (Population) | 16.6% | 8.6% |
Similar Demographics by Single Female Poverty
Demographics Similar to Spaniards by Single Female Poverty
In terms of single female poverty, the demographic groups most similar to Spaniards are Spanish (22.0%, a difference of 0.0%), Dutch (22.0%, a difference of 0.020%), Immigrants from Thailand (22.0%, a difference of 0.090%), Welsh (22.0%, a difference of 0.11%), and Immigrants from Ecuador (22.0%, a difference of 0.18%).
| Demographics | Rating | Rank | Single Female Poverty |
| Immigrants | Portugal | 5.8 /100 | #226 | Tragic 21.9% |
| Immigrants | Ghana | 5.8 /100 | #227 | Tragic 21.9% |
| Salvadorans | 5.5 /100 | #228 | Tragic 21.9% |
| Tlingit-Haida | 5.4 /100 | #229 | Tragic 21.9% |
| Immigrants | Western Africa | 5.3 /100 | #230 | Tragic 22.0% |
| Welsh | 5.0 /100 | #231 | Tragic 22.0% |
| Immigrants | Thailand | 5.0 /100 | #232 | Tragic 22.0% |
| Spaniards | 4.7 /100 | #233 | Tragic 22.0% |
| Spanish | 4.7 /100 | #234 | Tragic 22.0% |
| Dutch | 4.6 /100 | #235 | Tragic 22.0% |
| Immigrants | Ecuador | 4.2 /100 | #236 | Tragic 22.0% |
| Vietnamese | 4.0 /100 | #237 | Tragic 22.0% |
| French Canadians | 2.8 /100 | #238 | Tragic 22.2% |
| Malaysians | 2.8 /100 | #239 | Tragic 22.2% |
| French | 2.3 /100 | #240 | Tragic 22.2% |
Demographics Similar to Immigrants from Jordan by Single Female Poverty
In terms of single female poverty, the demographic groups most similar to Immigrants from Jordan are Paraguayan (19.3%, a difference of 0.060%), Immigrants from South Eastern Asia (19.3%, a difference of 0.070%), Immigrants from Latvia (19.3%, a difference of 0.070%), Immigrants from Peru (19.3%, a difference of 0.17%), and Immigrants from Belarus (19.3%, a difference of 0.19%).
| Demographics | Rating | Rank | Single Female Poverty |
| Immigrants | Northern Europe | 99.6 /100 | #63 | Exceptional 19.2% |
| Immigrants | Europe | 99.6 /100 | #64 | Exceptional 19.2% |
| Cypriots | 99.6 /100 | #65 | Exceptional 19.2% |
| Palestinians | 99.6 /100 | #66 | Exceptional 19.2% |
| Immigrants | Egypt | 99.6 /100 | #67 | Exceptional 19.2% |
| Laotians | 99.5 /100 | #68 | Exceptional 19.3% |
| Paraguayans | 99.5 /100 | #69 | Exceptional 19.3% |
| Immigrants | Jordan | 99.4 /100 | #70 | Exceptional 19.3% |
| Immigrants | South Eastern Asia | 99.4 /100 | #71 | Exceptional 19.3% |
| Immigrants | Latvia | 99.4 /100 | #72 | Exceptional 19.3% |
| Immigrants | Peru | 99.4 /100 | #73 | Exceptional 19.3% |
| Immigrants | Belarus | 99.4 /100 | #74 | Exceptional 19.3% |
| Immigrants | Turkey | 99.4 /100 | #75 | Exceptional 19.4% |
| Peruvians | 99.4 /100 | #76 | Exceptional 19.4% |
| Immigrants | Russia | 99.3 /100 | #77 | Exceptional 19.4% |