Spaniard vs Immigrants from El Salvador Master's Degree
COMPARE
Spaniard
Immigrants from El Salvador
Master's Degree
Master's Degree Comparison
Spaniards
Immigrants from El Salvador
14.6%
MASTER'S DEGREE
35.8/ 100
METRIC RATING
190th/ 347
METRIC RANK
12.0%
MASTER'S DEGREE
0.2/ 100
METRIC RATING
282nd/ 347
METRIC RANK
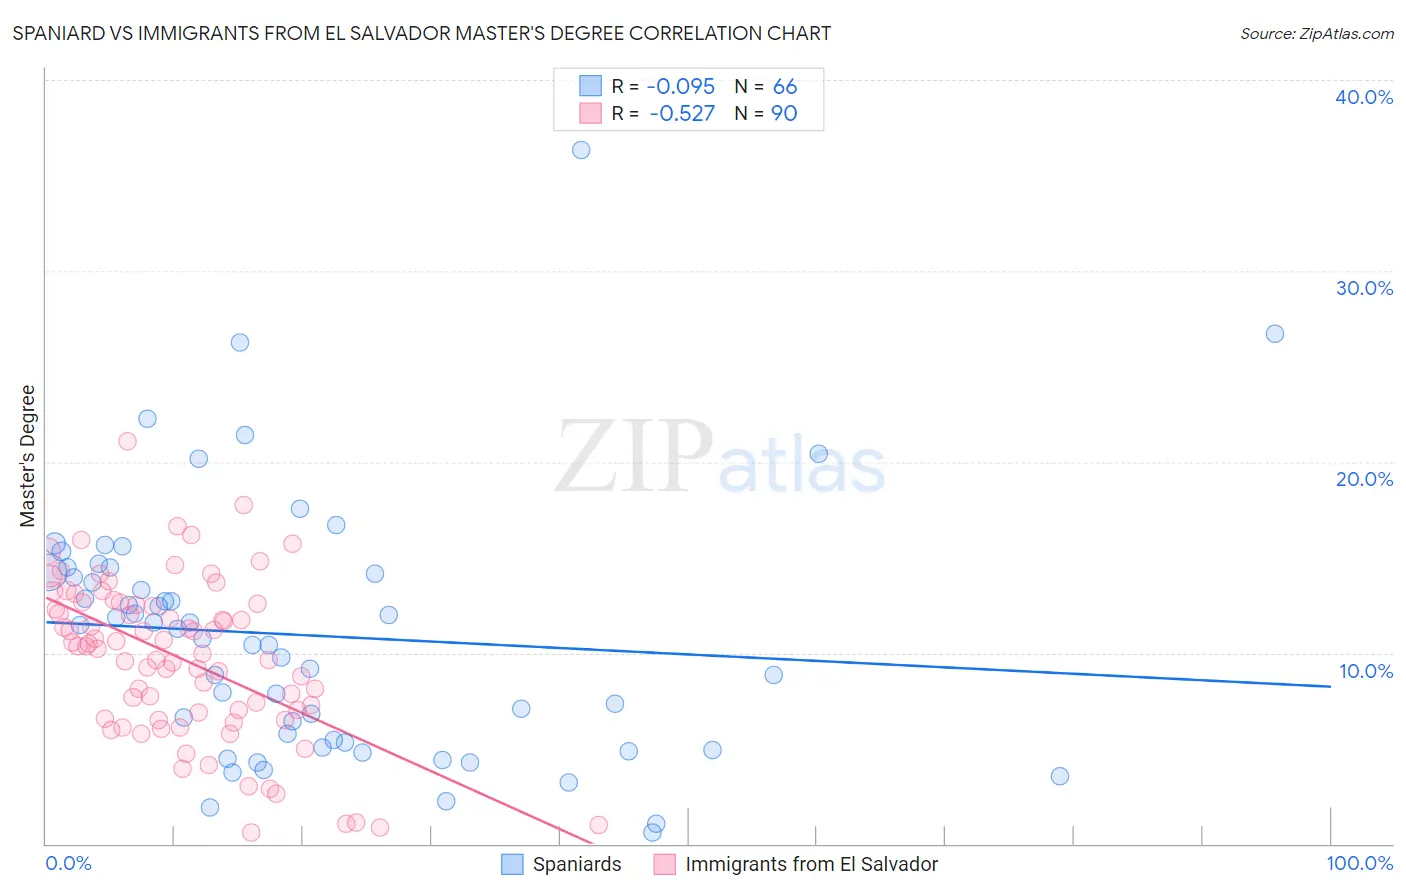
Spaniard vs Immigrants from El Salvador Master's Degree Correlation Chart
The statistical analysis conducted on geographies consisting of 443,325,255 people shows a slight negative correlation between the proportion of Spaniards and percentage of population with at least master's degree education in the United States with a correlation coefficient (R) of -0.095 and weighted average of 14.6%. Similarly, the statistical analysis conducted on geographies consisting of 357,699,051 people shows a substantial negative correlation between the proportion of Immigrants from El Salvador and percentage of population with at least master's degree education in the United States with a correlation coefficient (R) of -0.527 and weighted average of 12.0%, a difference of 22.0%.
Master's Degree Correlation Summary
| Measurement | Spaniard | Immigrants from El Salvador |
| Minimum | 0.56% | 0.61% |
| Maximum | 36.4% | 21.1% |
| Range | 35.8% | 20.5% |
| Mean | 10.9% | 9.7% |
| Median | 11.0% | 10.3% |
| Interquartile 25% (IQ1) | 5.3% | 6.8% |
| Interquartile 75% (IQ3) | 14.2% | 12.5% |
| Interquartile Range (IQR) | 8.9% | 5.7% |
| Standard Deviation (Sample) | 6.7% | 4.1% |
| Standard Deviation (Population) | 6.6% | 4.1% |
Similar Demographics by Master's Degree
Demographics Similar to Spaniards by Master's Degree
In terms of master's degree, the demographic groups most similar to Spaniards are Immigrants (14.6%, a difference of 0.020%), Immigrants from Costa Rica (14.7%, a difference of 0.060%), Basque (14.7%, a difference of 0.10%), Immigrants from Oceania (14.7%, a difference of 0.19%), and Welsh (14.6%, a difference of 0.23%).
| Demographics | Rating | Rank | Master's Degree |
| Sri Lankans | 39.6 /100 | #183 | Fair 14.7% |
| Immigrants | Zaire | 39.5 /100 | #184 | Fair 14.7% |
| Barbadians | 38.3 /100 | #185 | Fair 14.7% |
| Immigrants | Oceania | 37.1 /100 | #186 | Fair 14.7% |
| Basques | 36.5 /100 | #187 | Fair 14.7% |
| Immigrants | Costa Rica | 36.2 /100 | #188 | Fair 14.7% |
| Immigrants | Immigrants | 36.0 /100 | #189 | Fair 14.6% |
| Spaniards | 35.8 /100 | #190 | Fair 14.6% |
| Welsh | 34.2 /100 | #191 | Fair 14.6% |
| Immigrants | Middle Africa | 33.6 /100 | #192 | Fair 14.6% |
| Immigrants | Nigeria | 32.7 /100 | #193 | Fair 14.6% |
| Chinese | 32.5 /100 | #194 | Fair 14.6% |
| Danes | 31.3 /100 | #195 | Fair 14.5% |
| Czechoslovakians | 29.9 /100 | #196 | Fair 14.5% |
| Belgians | 28.0 /100 | #197 | Fair 14.5% |
Demographics Similar to Immigrants from El Salvador by Master's Degree
In terms of master's degree, the demographic groups most similar to Immigrants from El Salvador are Malaysian (12.0%, a difference of 0.31%), Honduran (11.9%, a difference of 0.41%), Immigrants from Dominican Republic (12.1%, a difference of 0.44%), Immigrants from Belize (12.1%, a difference of 0.49%), and Potawatomi (12.1%, a difference of 0.57%).
| Demographics | Rating | Rank | Master's Degree |
| Cubans | 0.3 /100 | #275 | Tragic 12.1% |
| Blacks/African Americans | 0.3 /100 | #276 | Tragic 12.1% |
| Immigrants | Caribbean | 0.3 /100 | #277 | Tragic 12.1% |
| Potawatomi | 0.3 /100 | #278 | Tragic 12.1% |
| Immigrants | Belize | 0.2 /100 | #279 | Tragic 12.1% |
| Immigrants | Dominican Republic | 0.2 /100 | #280 | Tragic 12.1% |
| Malaysians | 0.2 /100 | #281 | Tragic 12.0% |
| Immigrants | El Salvador | 0.2 /100 | #282 | Tragic 12.0% |
| Hondurans | 0.2 /100 | #283 | Tragic 11.9% |
| Ottawa | 0.2 /100 | #284 | Tragic 11.9% |
| Immigrants | Nicaragua | 0.2 /100 | #285 | Tragic 11.8% |
| Aleuts | 0.1 /100 | #286 | Tragic 11.8% |
| Immigrants | Haiti | 0.1 /100 | #287 | Tragic 11.8% |
| Immigrants | Honduras | 0.1 /100 | #288 | Tragic 11.8% |
| Guatemalans | 0.1 /100 | #289 | Tragic 11.7% |