Spaniard vs Immigrants from Philippines Master's Degree
COMPARE
Spaniard
Immigrants from Philippines
Master's Degree
Master's Degree Comparison
Spaniards
Immigrants from Philippines
14.6%
MASTER'S DEGREE
35.8/ 100
METRIC RATING
190th/ 347
METRIC RANK
13.6%
MASTER'S DEGREE
6.0/ 100
METRIC RATING
232nd/ 347
METRIC RANK
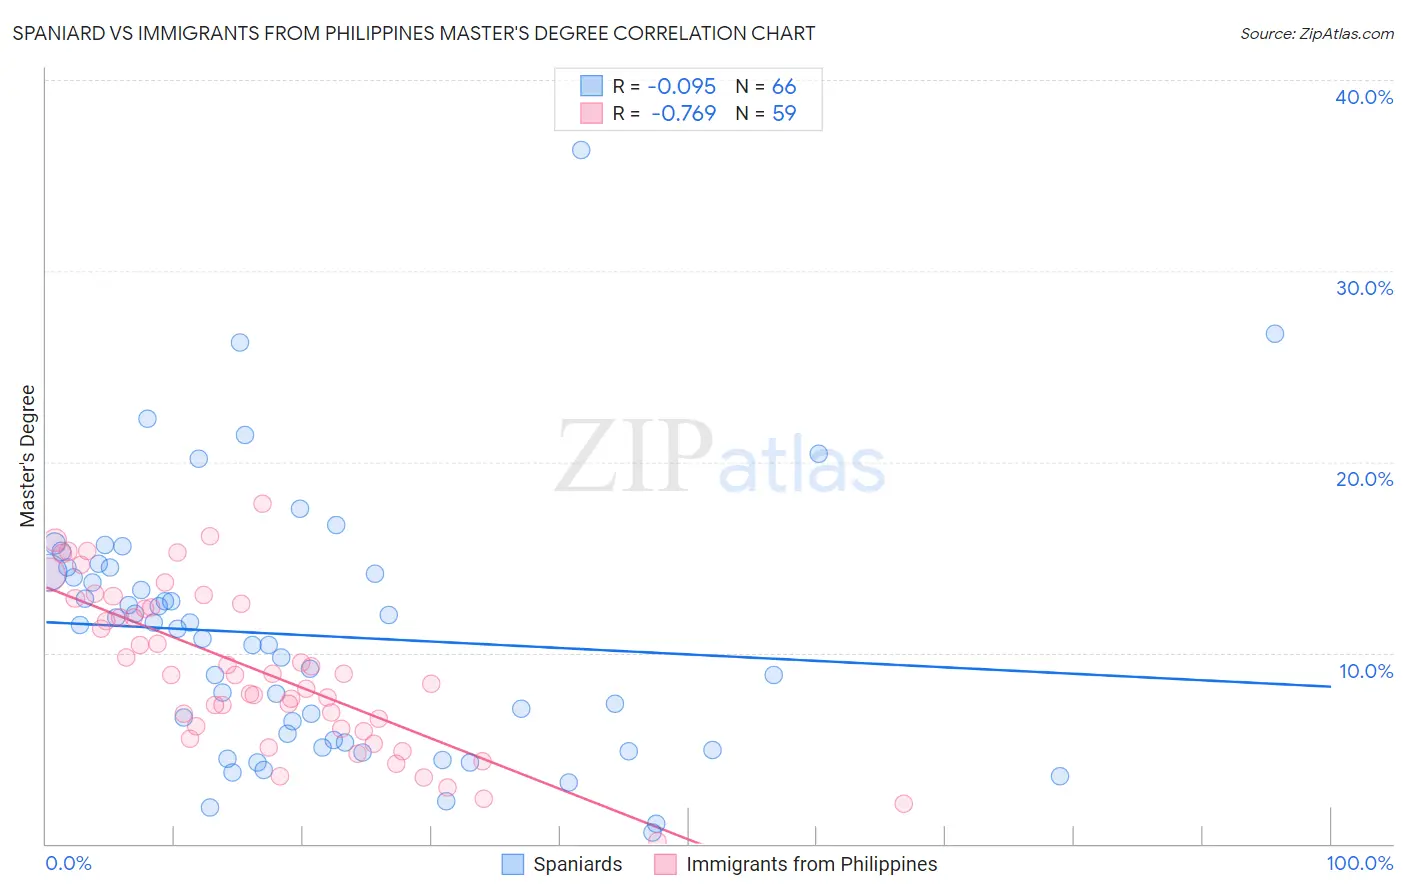
Spaniard vs Immigrants from Philippines Master's Degree Correlation Chart
The statistical analysis conducted on geographies consisting of 443,325,255 people shows a slight negative correlation between the proportion of Spaniards and percentage of population with at least master's degree education in the United States with a correlation coefficient (R) of -0.095 and weighted average of 14.6%. Similarly, the statistical analysis conducted on geographies consisting of 471,142,427 people shows a strong negative correlation between the proportion of Immigrants from Philippines and percentage of population with at least master's degree education in the United States with a correlation coefficient (R) of -0.769 and weighted average of 13.6%, a difference of 7.6%.
Master's Degree Correlation Summary
| Measurement | Spaniard | Immigrants from Philippines |
| Minimum | 0.56% | 0.15% |
| Maximum | 36.4% | 17.8% |
| Range | 35.8% | 17.6% |
| Mean | 10.9% | 9.1% |
| Median | 11.0% | 8.9% |
| Interquartile 25% (IQ1) | 5.3% | 6.1% |
| Interquartile 75% (IQ3) | 14.2% | 12.6% |
| Interquartile Range (IQR) | 8.9% | 6.5% |
| Standard Deviation (Sample) | 6.7% | 4.1% |
| Standard Deviation (Population) | 6.6% | 4.1% |
Similar Demographics by Master's Degree
Demographics Similar to Spaniards by Master's Degree
In terms of master's degree, the demographic groups most similar to Spaniards are Immigrants (14.6%, a difference of 0.020%), Immigrants from Costa Rica (14.7%, a difference of 0.060%), Basque (14.7%, a difference of 0.10%), Immigrants from Oceania (14.7%, a difference of 0.19%), and Welsh (14.6%, a difference of 0.23%).
| Demographics | Rating | Rank | Master's Degree |
| Sri Lankans | 39.6 /100 | #183 | Fair 14.7% |
| Immigrants | Zaire | 39.5 /100 | #184 | Fair 14.7% |
| Barbadians | 38.3 /100 | #185 | Fair 14.7% |
| Immigrants | Oceania | 37.1 /100 | #186 | Fair 14.7% |
| Basques | 36.5 /100 | #187 | Fair 14.7% |
| Immigrants | Costa Rica | 36.2 /100 | #188 | Fair 14.7% |
| Immigrants | Immigrants | 36.0 /100 | #189 | Fair 14.6% |
| Spaniards | 35.8 /100 | #190 | Fair 14.6% |
| Welsh | 34.2 /100 | #191 | Fair 14.6% |
| Immigrants | Middle Africa | 33.6 /100 | #192 | Fair 14.6% |
| Immigrants | Nigeria | 32.7 /100 | #193 | Fair 14.6% |
| Chinese | 32.5 /100 | #194 | Fair 14.6% |
| Danes | 31.3 /100 | #195 | Fair 14.5% |
| Czechoslovakians | 29.9 /100 | #196 | Fair 14.5% |
| Belgians | 28.0 /100 | #197 | Fair 14.5% |
Demographics Similar to Immigrants from Philippines by Master's Degree
In terms of master's degree, the demographic groups most similar to Immigrants from Philippines are Immigrants from Ecuador (13.6%, a difference of 0.15%), Immigrants from Burma/Myanmar (13.5%, a difference of 0.65%), Guyanese (13.7%, a difference of 0.88%), German Russian (13.5%, a difference of 1.1%), and Immigrants from Guyana (13.4%, a difference of 1.2%).
| Demographics | Rating | Rank | Master's Degree |
| Portuguese | 11.2 /100 | #225 | Poor 13.9% |
| Immigrants | St. Vincent and the Grenadines | 11.0 /100 | #226 | Poor 13.9% |
| Immigrants | West Indies | 9.8 /100 | #227 | Tragic 13.9% |
| Whites/Caucasians | 9.1 /100 | #228 | Tragic 13.8% |
| British West Indians | 8.8 /100 | #229 | Tragic 13.8% |
| Dutch | 8.7 /100 | #230 | Tragic 13.8% |
| Guyanese | 7.6 /100 | #231 | Tragic 13.7% |
| Immigrants | Philippines | 6.0 /100 | #232 | Tragic 13.6% |
| Immigrants | Ecuador | 5.7 /100 | #233 | Tragic 13.6% |
| Immigrants | Burma/Myanmar | 5.0 /100 | #234 | Tragic 13.5% |
| German Russians | 4.5 /100 | #235 | Tragic 13.5% |
| Immigrants | Guyana | 4.4 /100 | #236 | Tragic 13.4% |
| Jamaicans | 4.1 /100 | #237 | Tragic 13.4% |
| Hmong | 4.0 /100 | #238 | Tragic 13.4% |
| Immigrants | Nonimmigrants | 3.4 /100 | #239 | Tragic 13.3% |