Ugandan vs Immigrants from Jordan Master's Degree
COMPARE
Ugandan
Immigrants from Jordan
Master's Degree
Master's Degree Comparison
Ugandans
Immigrants from Jordan
17.1%
MASTER'S DEGREE
99.0/ 100
METRIC RATING
94th/ 347
METRIC RANK
16.1%
MASTER'S DEGREE
92.7/ 100
METRIC RATING
130th/ 347
METRIC RANK
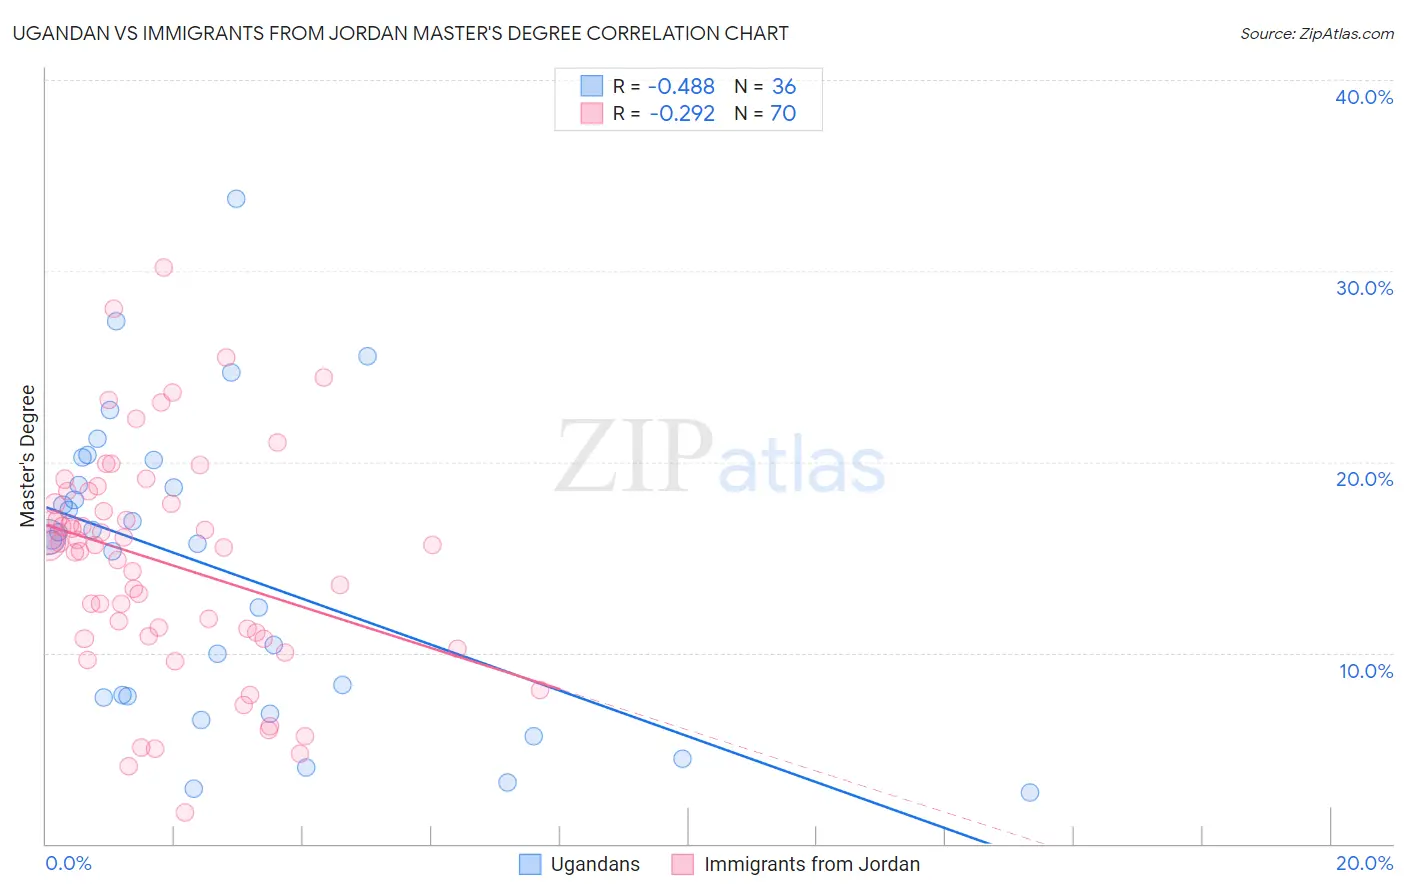
Ugandan vs Immigrants from Jordan Master's Degree Correlation Chart
The statistical analysis conducted on geographies consisting of 93,998,017 people shows a moderate negative correlation between the proportion of Ugandans and percentage of population with at least master's degree education in the United States with a correlation coefficient (R) of -0.488 and weighted average of 17.1%. Similarly, the statistical analysis conducted on geographies consisting of 181,260,890 people shows a weak negative correlation between the proportion of Immigrants from Jordan and percentage of population with at least master's degree education in the United States with a correlation coefficient (R) of -0.292 and weighted average of 16.1%, a difference of 6.2%.
Master's Degree Correlation Summary
| Measurement | Ugandan | Immigrants from Jordan |
| Minimum | 2.7% | 1.6% |
| Maximum | 33.8% | 30.2% |
| Range | 31.1% | 28.6% |
| Mean | 14.4% | 14.7% |
| Median | 16.0% | 15.6% |
| Interquartile 25% (IQ1) | 7.7% | 10.9% |
| Interquartile 75% (IQ3) | 19.4% | 17.8% |
| Interquartile Range (IQR) | 11.8% | 6.9% |
| Standard Deviation (Sample) | 7.7% | 5.8% |
| Standard Deviation (Population) | 7.6% | 5.8% |
Similar Demographics by Master's Degree
Demographics Similar to Ugandans by Master's Degree
In terms of master's degree, the demographic groups most similar to Ugandans are Immigrants from Italy (17.2%, a difference of 0.13%), Immigrants from North America (17.2%, a difference of 0.19%), Romanian (17.2%, a difference of 0.24%), Immigrants from Egypt (17.2%, a difference of 0.31%), and Immigrants from Morocco (17.1%, a difference of 0.32%).
| Demographics | Rating | Rank | Master's Degree |
| Maltese | 99.3 /100 | #87 | Exceptional 17.3% |
| Immigrants | Canada | 99.2 /100 | #88 | Exceptional 17.2% |
| Bhutanese | 99.1 /100 | #89 | Exceptional 17.2% |
| Immigrants | Egypt | 99.1 /100 | #90 | Exceptional 17.2% |
| Romanians | 99.1 /100 | #91 | Exceptional 17.2% |
| Immigrants | North America | 99.1 /100 | #92 | Exceptional 17.2% |
| Immigrants | Italy | 99.1 /100 | #93 | Exceptional 17.2% |
| Ugandans | 99.0 /100 | #94 | Exceptional 17.1% |
| Immigrants | Morocco | 98.9 /100 | #95 | Exceptional 17.1% |
| Immigrants | Northern Africa | 98.9 /100 | #96 | Exceptional 17.1% |
| Immigrants | England | 98.8 /100 | #97 | Exceptional 17.0% |
| Immigrants | Ukraine | 98.8 /100 | #98 | Exceptional 17.0% |
| Laotians | 98.8 /100 | #99 | Exceptional 17.0% |
| Albanians | 98.7 /100 | #100 | Exceptional 17.0% |
| Immigrants | Nepal | 98.6 /100 | #101 | Exceptional 17.0% |
Demographics Similar to Immigrants from Jordan by Master's Degree
In terms of master's degree, the demographic groups most similar to Immigrants from Jordan are Immigrants from Syria (16.2%, a difference of 0.26%), Taiwanese (16.1%, a difference of 0.32%), Serbian (16.1%, a difference of 0.41%), Immigrants from Sudan (16.0%, a difference of 0.95%), and Immigrants from Sierra Leone (16.3%, a difference of 1.0%).
| Demographics | Rating | Rank | Master's Degree |
| Croatians | 95.6 /100 | #123 | Exceptional 16.4% |
| Immigrants | Eritrea | 95.5 /100 | #124 | Exceptional 16.4% |
| Italians | 95.4 /100 | #125 | Exceptional 16.4% |
| Immigrants | Eastern Africa | 95.2 /100 | #126 | Exceptional 16.3% |
| Palestinians | 94.8 /100 | #127 | Exceptional 16.3% |
| Immigrants | Sierra Leone | 94.7 /100 | #128 | Exceptional 16.3% |
| Immigrants | Syria | 93.3 /100 | #129 | Exceptional 16.2% |
| Immigrants | Jordan | 92.7 /100 | #130 | Exceptional 16.1% |
| Taiwanese | 91.9 /100 | #131 | Exceptional 16.1% |
| Serbians | 91.7 /100 | #132 | Exceptional 16.1% |
| Immigrants | Sudan | 90.2 /100 | #133 | Exceptional 16.0% |
| Venezuelans | 88.4 /100 | #134 | Excellent 15.9% |
| South American Indians | 88.4 /100 | #135 | Excellent 15.9% |
| Assyrians/Chaldeans/Syriacs | 86.8 /100 | #136 | Excellent 15.8% |
| Europeans | 86.4 /100 | #137 | Excellent 15.8% |