Immigrants from Eastern Asia vs Immigrants from Jordan Master's Degree
COMPARE
Immigrants from Eastern Asia
Immigrants from Jordan
Master's Degree
Master's Degree Comparison
Immigrants from Eastern Asia
Immigrants from Jordan
20.8%
MASTER'S DEGREE
100.0/ 100
METRIC RATING
15th/ 347
METRIC RANK
16.1%
MASTER'S DEGREE
92.7/ 100
METRIC RATING
130th/ 347
METRIC RANK
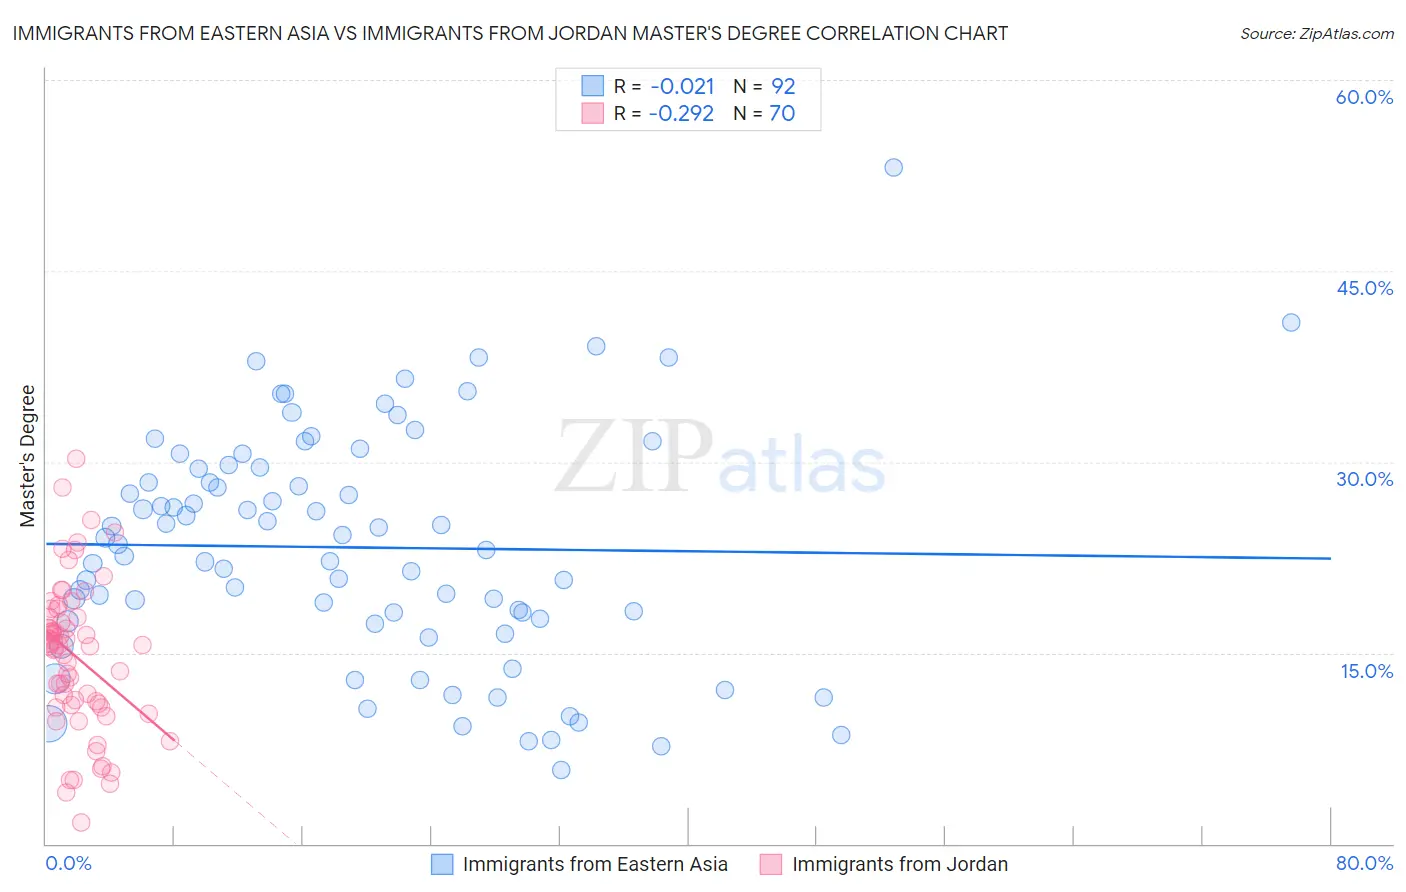
Immigrants from Eastern Asia vs Immigrants from Jordan Master's Degree Correlation Chart
The statistical analysis conducted on geographies consisting of 499,625,915 people shows no correlation between the proportion of Immigrants from Eastern Asia and percentage of population with at least master's degree education in the United States with a correlation coefficient (R) of -0.021 and weighted average of 20.8%. Similarly, the statistical analysis conducted on geographies consisting of 181,260,890 people shows a weak negative correlation between the proportion of Immigrants from Jordan and percentage of population with at least master's degree education in the United States with a correlation coefficient (R) of -0.292 and weighted average of 16.1%, a difference of 29.1%.
Master's Degree Correlation Summary
| Measurement | Immigrants from Eastern Asia | Immigrants from Jordan |
| Minimum | 5.8% | 1.6% |
| Maximum | 53.1% | 30.2% |
| Range | 47.3% | 28.6% |
| Mean | 23.3% | 14.7% |
| Median | 23.3% | 15.6% |
| Interquartile 25% (IQ1) | 17.6% | 10.9% |
| Interquartile 75% (IQ3) | 29.5% | 17.8% |
| Interquartile Range (IQR) | 11.9% | 6.9% |
| Standard Deviation (Sample) | 9.1% | 5.8% |
| Standard Deviation (Population) | 9.1% | 5.8% |
Similar Demographics by Master's Degree
Demographics Similar to Immigrants from Eastern Asia by Master's Degree
In terms of master's degree, the demographic groups most similar to Immigrants from Eastern Asia are Immigrants from Switzerland (20.9%, a difference of 0.18%), Immigrants from Australia (20.9%, a difference of 0.19%), Immigrants from Belgium (20.8%, a difference of 0.29%), Immigrants from South Central Asia (20.7%, a difference of 0.54%), and Eastern European (21.1%, a difference of 1.4%).
| Demographics | Rating | Rank | Master's Degree |
| Cypriots | 100.0 /100 | #8 | Exceptional 21.8% |
| Thais | 100.0 /100 | #9 | Exceptional 21.7% |
| Immigrants | Iran | 100.0 /100 | #10 | Exceptional 21.6% |
| Immigrants | China | 100.0 /100 | #11 | Exceptional 21.2% |
| Eastern Europeans | 100.0 /100 | #12 | Exceptional 21.1% |
| Immigrants | Australia | 100.0 /100 | #13 | Exceptional 20.9% |
| Immigrants | Switzerland | 100.0 /100 | #14 | Exceptional 20.9% |
| Immigrants | Eastern Asia | 100.0 /100 | #15 | Exceptional 20.8% |
| Immigrants | Belgium | 100.0 /100 | #16 | Exceptional 20.8% |
| Immigrants | South Central Asia | 100.0 /100 | #17 | Exceptional 20.7% |
| Soviet Union | 100.0 /100 | #18 | Exceptional 20.5% |
| Immigrants | Hong Kong | 100.0 /100 | #19 | Exceptional 20.5% |
| Indians (Asian) | 100.0 /100 | #20 | Exceptional 20.5% |
| Immigrants | Ireland | 100.0 /100 | #21 | Exceptional 20.4% |
| Israelis | 100.0 /100 | #22 | Exceptional 20.3% |
Demographics Similar to Immigrants from Jordan by Master's Degree
In terms of master's degree, the demographic groups most similar to Immigrants from Jordan are Immigrants from Syria (16.2%, a difference of 0.26%), Taiwanese (16.1%, a difference of 0.32%), Serbian (16.1%, a difference of 0.41%), Immigrants from Sudan (16.0%, a difference of 0.95%), and Immigrants from Sierra Leone (16.3%, a difference of 1.0%).
| Demographics | Rating | Rank | Master's Degree |
| Croatians | 95.6 /100 | #123 | Exceptional 16.4% |
| Immigrants | Eritrea | 95.5 /100 | #124 | Exceptional 16.4% |
| Italians | 95.4 /100 | #125 | Exceptional 16.4% |
| Immigrants | Eastern Africa | 95.2 /100 | #126 | Exceptional 16.3% |
| Palestinians | 94.8 /100 | #127 | Exceptional 16.3% |
| Immigrants | Sierra Leone | 94.7 /100 | #128 | Exceptional 16.3% |
| Immigrants | Syria | 93.3 /100 | #129 | Exceptional 16.2% |
| Immigrants | Jordan | 92.7 /100 | #130 | Exceptional 16.1% |
| Taiwanese | 91.9 /100 | #131 | Exceptional 16.1% |
| Serbians | 91.7 /100 | #132 | Exceptional 16.1% |
| Immigrants | Sudan | 90.2 /100 | #133 | Exceptional 16.0% |
| Venezuelans | 88.4 /100 | #134 | Excellent 15.9% |
| South American Indians | 88.4 /100 | #135 | Excellent 15.9% |
| Assyrians/Chaldeans/Syriacs | 86.8 /100 | #136 | Excellent 15.8% |
| Europeans | 86.4 /100 | #137 | Excellent 15.8% |