Spaniard vs Immigrants from Cambodia Nursery School
COMPARE
Spaniard
Immigrants from Cambodia
Nursery School
Nursery School Comparison
Spaniards
Immigrants from Cambodia
98.2%
NURSERY SCHOOL
91.1/ 100
METRIC RATING
131st/ 347
METRIC RANK
96.5%
NURSERY SCHOOL
0.0/ 100
METRIC RATING
337th/ 347
METRIC RANK
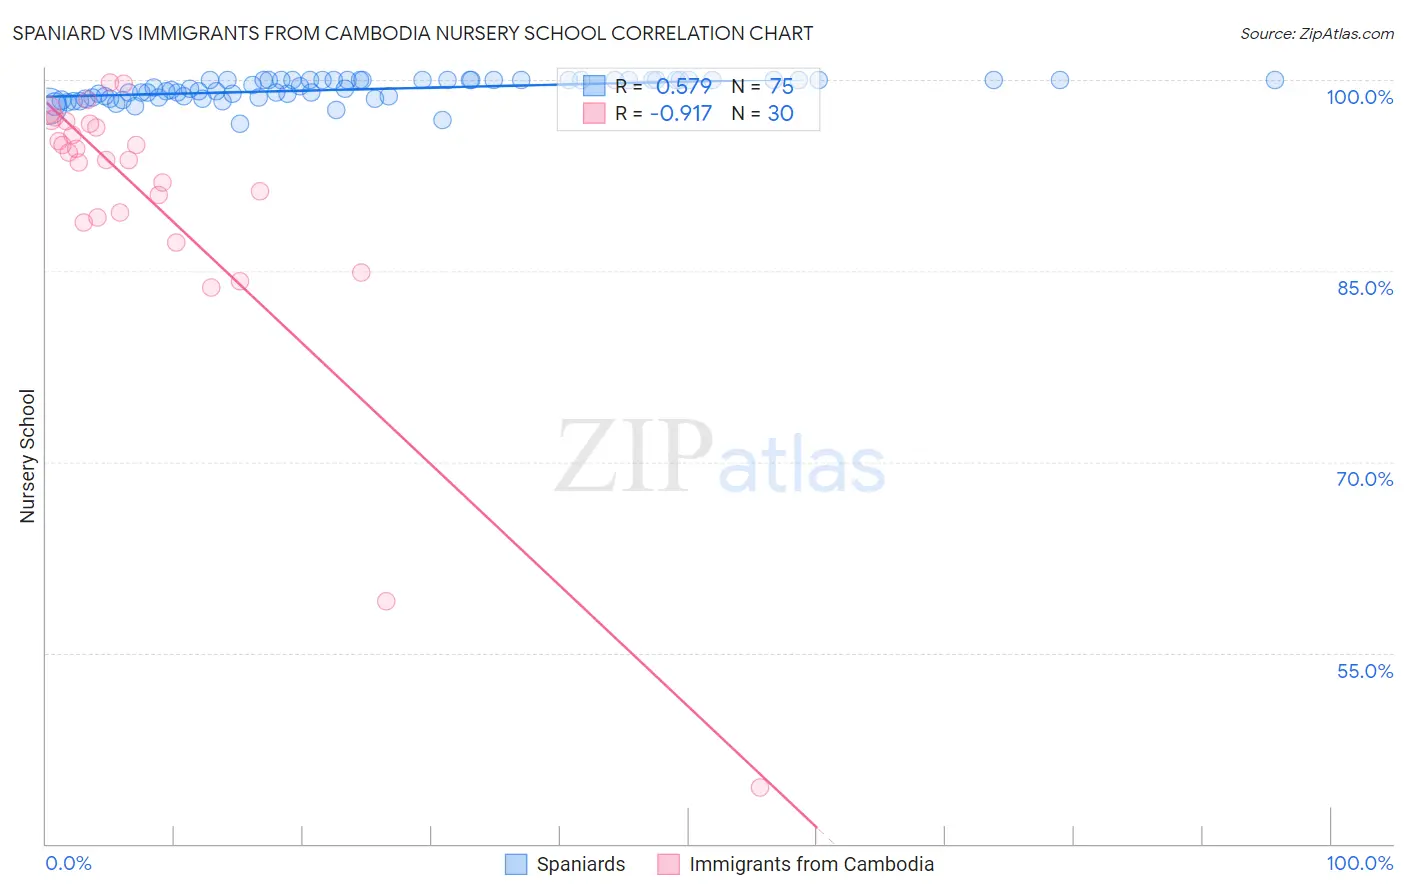
Spaniard vs Immigrants from Cambodia Nursery School Correlation Chart
The statistical analysis conducted on geographies consisting of 443,544,503 people shows a substantial positive correlation between the proportion of Spaniards and percentage of population with at least nursery school education in the United States with a correlation coefficient (R) of 0.579 and weighted average of 98.2%. Similarly, the statistical analysis conducted on geographies consisting of 205,153,442 people shows a near-perfect negative correlation between the proportion of Immigrants from Cambodia and percentage of population with at least nursery school education in the United States with a correlation coefficient (R) of -0.917 and weighted average of 96.5%, a difference of 1.7%.
Nursery School Correlation Summary
| Measurement | Spaniard | Immigrants from Cambodia |
| Minimum | 96.6% | 44.4% |
| Maximum | 100.0% | 99.8% |
| Range | 3.4% | 55.4% |
| Mean | 99.3% | 90.5% |
| Median | 99.3% | 94.0% |
| Interquartile 25% (IQ1) | 98.7% | 89.2% |
| Interquartile 75% (IQ3) | 100.0% | 96.6% |
| Interquartile Range (IQR) | 1.3% | 7.4% |
| Standard Deviation (Sample) | 0.83% | 11.6% |
| Standard Deviation (Population) | 0.82% | 11.4% |
Similar Demographics by Nursery School
Demographics Similar to Spaniards by Nursery School
In terms of nursery school, the demographic groups most similar to Spaniards are Cambodian (98.2%, a difference of 0.0%), Immigrants from Croatia (98.2%, a difference of 0.0%), Seminole (98.2%, a difference of 0.0%), Immigrants from Europe (98.1%, a difference of 0.0%), and Immigrants from Serbia (98.2%, a difference of 0.010%).
| Demographics | Rating | Rank | Nursery School |
| Lebanese | 93.8 /100 | #124 | Exceptional 98.2% |
| Iroquois | 93.7 /100 | #125 | Exceptional 98.2% |
| Menominee | 93.6 /100 | #126 | Exceptional 98.2% |
| Immigrants | Saudi Arabia | 93.4 /100 | #127 | Exceptional 98.2% |
| Immigrants | Serbia | 92.4 /100 | #128 | Exceptional 98.2% |
| Cambodians | 91.4 /100 | #129 | Exceptional 98.2% |
| Immigrants | Croatia | 91.4 /100 | #130 | Exceptional 98.2% |
| Spaniards | 91.1 /100 | #131 | Exceptional 98.2% |
| Seminole | 90.9 /100 | #132 | Exceptional 98.2% |
| Immigrants | Europe | 90.7 /100 | #133 | Exceptional 98.1% |
| Immigrants | Bulgaria | 89.4 /100 | #134 | Excellent 98.1% |
| Immigrants | Hungary | 89.3 /100 | #135 | Excellent 98.1% |
| Immigrants | Kuwait | 88.9 /100 | #136 | Excellent 98.1% |
| Israelis | 88.2 /100 | #137 | Excellent 98.1% |
| Immigrants | Romania | 88.0 /100 | #138 | Excellent 98.1% |
Demographics Similar to Immigrants from Cambodia by Nursery School
In terms of nursery school, the demographic groups most similar to Immigrants from Cambodia are Immigrants from Fiji (96.5%, a difference of 0.0%), Guatemalan (96.6%, a difference of 0.040%), Bangladeshi (96.6%, a difference of 0.070%), Immigrants from Guatemala (96.4%, a difference of 0.080%), and Immigrants from Dominican Republic (96.6%, a difference of 0.090%).
| Demographics | Rating | Rank | Nursery School |
| Japanese | 0.0 /100 | #330 | Tragic 96.7% |
| Immigrants | Armenia | 0.0 /100 | #331 | Tragic 96.7% |
| Yakama | 0.0 /100 | #332 | Tragic 96.6% |
| Central Americans | 0.0 /100 | #333 | Tragic 96.6% |
| Immigrants | Dominican Republic | 0.0 /100 | #334 | Tragic 96.6% |
| Bangladeshis | 0.0 /100 | #335 | Tragic 96.6% |
| Guatemalans | 0.0 /100 | #336 | Tragic 96.6% |
| Immigrants | Cambodia | 0.0 /100 | #337 | Tragic 96.5% |
| Immigrants | Fiji | 0.0 /100 | #338 | Tragic 96.5% |
| Immigrants | Guatemala | 0.0 /100 | #339 | Tragic 96.4% |
| Immigrants | Central America | 0.0 /100 | #340 | Tragic 96.4% |
| Immigrants | Cabo Verde | 0.0 /100 | #341 | Tragic 96.4% |
| Immigrants | Mexico | 0.0 /100 | #342 | Tragic 96.4% |
| Salvadorans | 0.0 /100 | #343 | Tragic 96.4% |
| Immigrants | El Salvador | 0.0 /100 | #344 | Tragic 96.2% |