Spaniard vs Afghan Nursery School
COMPARE
Spaniard
Afghan
Nursery School
Nursery School Comparison
Spaniards
Afghans
98.2%
NURSERY SCHOOL
91.1/ 100
METRIC RATING
131st/ 347
METRIC RANK
97.4%
NURSERY SCHOOL
0.0/ 100
METRIC RATING
282nd/ 347
METRIC RANK
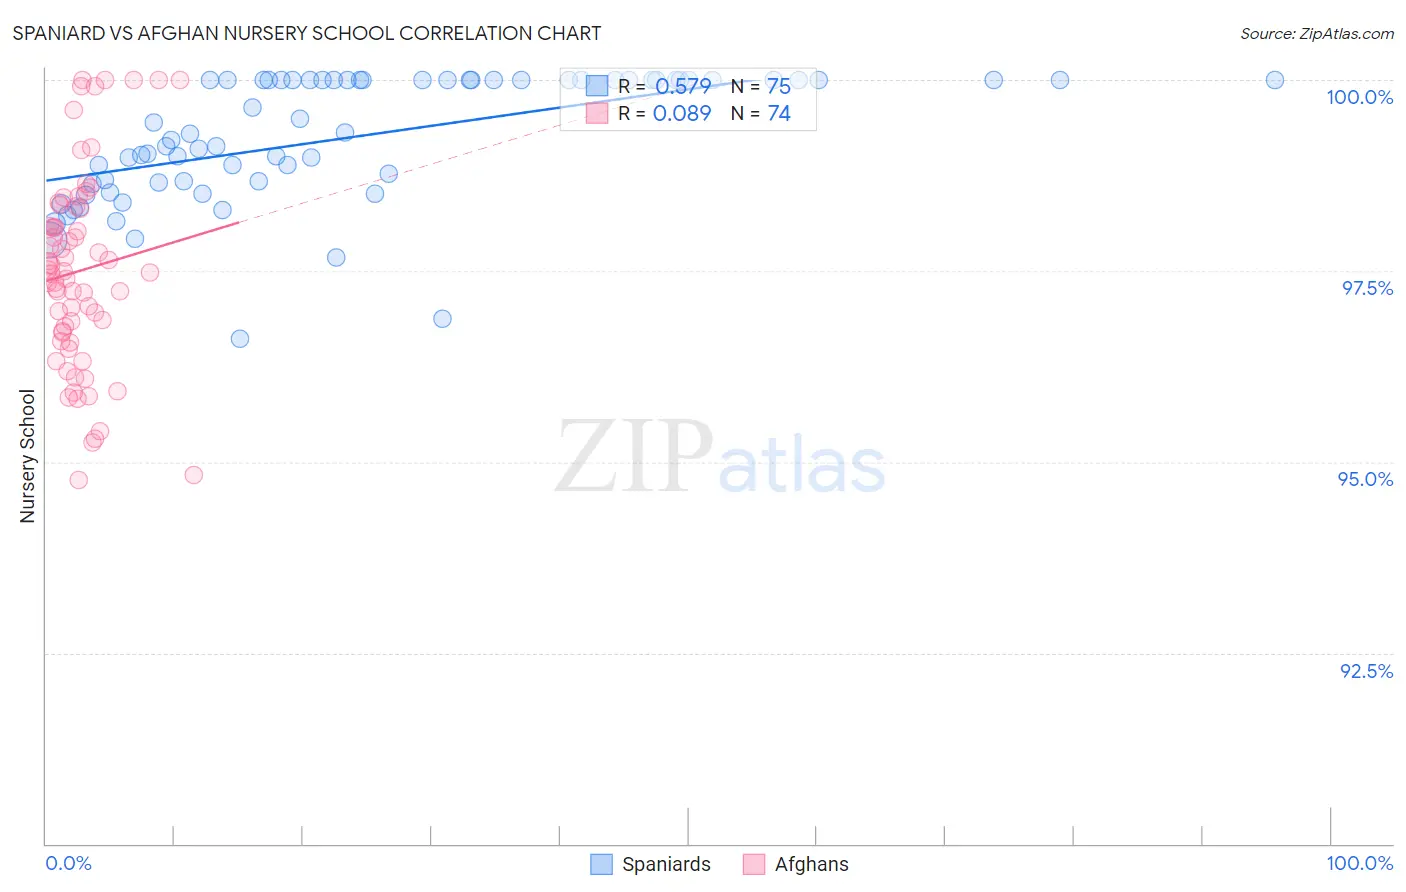
Spaniard vs Afghan Nursery School Correlation Chart
The statistical analysis conducted on geographies consisting of 443,544,503 people shows a substantial positive correlation between the proportion of Spaniards and percentage of population with at least nursery school education in the United States with a correlation coefficient (R) of 0.579 and weighted average of 98.2%. Similarly, the statistical analysis conducted on geographies consisting of 148,851,685 people shows a slight positive correlation between the proportion of Afghans and percentage of population with at least nursery school education in the United States with a correlation coefficient (R) of 0.089 and weighted average of 97.4%, a difference of 0.75%.
Nursery School Correlation Summary
| Measurement | Spaniard | Afghan |
| Minimum | 96.6% | 94.8% |
| Maximum | 100.0% | 100.0% |
| Range | 3.4% | 5.2% |
| Mean | 99.3% | 97.5% |
| Median | 99.3% | 97.5% |
| Interquartile 25% (IQ1) | 98.7% | 96.7% |
| Interquartile 75% (IQ3) | 100.0% | 98.3% |
| Interquartile Range (IQR) | 1.3% | 1.6% |
| Standard Deviation (Sample) | 0.83% | 1.3% |
| Standard Deviation (Population) | 0.82% | 1.3% |
Similar Demographics by Nursery School
Demographics Similar to Spaniards by Nursery School
In terms of nursery school, the demographic groups most similar to Spaniards are Cambodian (98.2%, a difference of 0.0%), Immigrants from Croatia (98.2%, a difference of 0.0%), Seminole (98.2%, a difference of 0.0%), Immigrants from Europe (98.1%, a difference of 0.0%), and Immigrants from Serbia (98.2%, a difference of 0.010%).
| Demographics | Rating | Rank | Nursery School |
| Lebanese | 93.8 /100 | #124 | Exceptional 98.2% |
| Iroquois | 93.7 /100 | #125 | Exceptional 98.2% |
| Menominee | 93.6 /100 | #126 | Exceptional 98.2% |
| Immigrants | Saudi Arabia | 93.4 /100 | #127 | Exceptional 98.2% |
| Immigrants | Serbia | 92.4 /100 | #128 | Exceptional 98.2% |
| Cambodians | 91.4 /100 | #129 | Exceptional 98.2% |
| Immigrants | Croatia | 91.4 /100 | #130 | Exceptional 98.2% |
| Spaniards | 91.1 /100 | #131 | Exceptional 98.2% |
| Seminole | 90.9 /100 | #132 | Exceptional 98.2% |
| Immigrants | Europe | 90.7 /100 | #133 | Exceptional 98.1% |
| Immigrants | Bulgaria | 89.4 /100 | #134 | Excellent 98.1% |
| Immigrants | Hungary | 89.3 /100 | #135 | Excellent 98.1% |
| Immigrants | Kuwait | 88.9 /100 | #136 | Excellent 98.1% |
| Israelis | 88.2 /100 | #137 | Excellent 98.1% |
| Immigrants | Romania | 88.0 /100 | #138 | Excellent 98.1% |
Demographics Similar to Afghans by Nursery School
In terms of nursery school, the demographic groups most similar to Afghans are Barbadian (97.4%, a difference of 0.0%), Trinidadian and Tobagonian (97.4%, a difference of 0.0%), Immigrants from Ghana (97.4%, a difference of 0.010%), Immigrants from Uzbekistan (97.4%, a difference of 0.020%), and Immigrants from Western Africa (97.4%, a difference of 0.030%).
| Demographics | Rating | Rank | Nursery School |
| Ghanaians | 0.1 /100 | #275 | Tragic 97.5% |
| Immigrants | Philippines | 0.1 /100 | #276 | Tragic 97.5% |
| Immigrants | Western Africa | 0.1 /100 | #277 | Tragic 97.4% |
| Immigrants | Uzbekistan | 0.1 /100 | #278 | Tragic 97.4% |
| Immigrants | Ghana | 0.1 /100 | #279 | Tragic 97.4% |
| Barbadians | 0.0 /100 | #280 | Tragic 97.4% |
| Trinidadians and Tobagonians | 0.0 /100 | #281 | Tragic 97.4% |
| Afghans | 0.0 /100 | #282 | Tragic 97.4% |
| Immigrants | West Indies | 0.0 /100 | #283 | Tragic 97.4% |
| Immigrants | Trinidad and Tobago | 0.0 /100 | #284 | Tragic 97.4% |
| Immigrants | Barbados | 0.0 /100 | #285 | Tragic 97.4% |
| Immigrants | Portugal | 0.0 /100 | #286 | Tragic 97.4% |
| Immigrants | Hong Kong | 0.0 /100 | #287 | Tragic 97.4% |
| Immigrants | Thailand | 0.0 /100 | #288 | Tragic 97.3% |
| Immigrants | St. Vincent and the Grenadines | 0.0 /100 | #289 | Tragic 97.3% |