Spaniard vs Immigrants from Cambodia Births to Unmarried Women
COMPARE
Spaniard
Immigrants from Cambodia
Births to Unmarried Women
Births to Unmarried Women Comparison
Spaniards
Immigrants from Cambodia
33.6%
BIRTHS TO UNMARRIED WOMEN
7.0/ 100
METRIC RATING
217th/ 347
METRIC RANK
34.8%
BIRTHS TO UNMARRIED WOMEN
1.6/ 100
METRIC RATING
238th/ 347
METRIC RANK
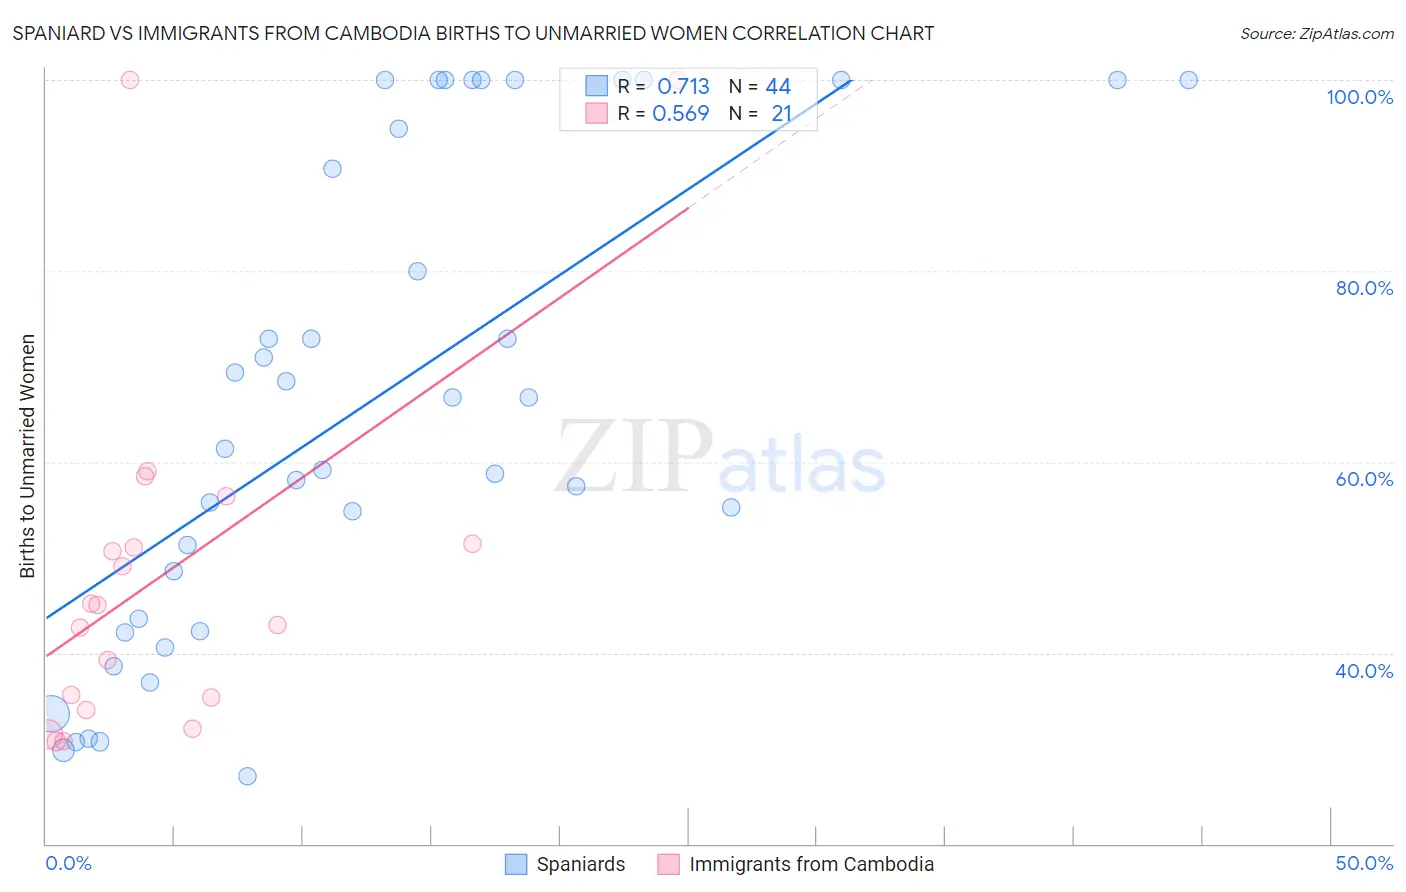
Spaniard vs Immigrants from Cambodia Births to Unmarried Women Correlation Chart
The statistical analysis conducted on geographies consisting of 411,709,263 people shows a strong positive correlation between the proportion of Spaniards and percentage of births to unmarried women in the United States with a correlation coefficient (R) of 0.713 and weighted average of 33.6%. Similarly, the statistical analysis conducted on geographies consisting of 198,809,651 people shows a substantial positive correlation between the proportion of Immigrants from Cambodia and percentage of births to unmarried women in the United States with a correlation coefficient (R) of 0.569 and weighted average of 34.8%, a difference of 3.5%.
Births to Unmarried Women Correlation Summary
| Measurement | Spaniard | Immigrants from Cambodia |
| Minimum | 27.1% | 30.7% |
| Maximum | 100.0% | 100.0% |
| Range | 72.9% | 69.3% |
| Mean | 66.2% | 48.6% |
| Median | 64.1% | 45.0% |
| Interquartile 25% (IQ1) | 42.9% | 34.6% |
| Interquartile 75% (IQ3) | 97.4% | 53.9% |
| Interquartile Range (IQR) | 54.5% | 19.3% |
| Standard Deviation (Sample) | 25.1% | 19.4% |
| Standard Deviation (Population) | 24.8% | 18.9% |
Similar Demographics by Births to Unmarried Women
Demographics Similar to Spaniards by Births to Unmarried Women
In terms of births to unmarried women, the demographic groups most similar to Spaniards are Nepalese (33.5%, a difference of 0.24%), Immigrants from Ecuador (33.7%, a difference of 0.40%), French (33.4%, a difference of 0.51%), Alsatian (33.8%, a difference of 0.62%), and Portuguese (33.8%, a difference of 0.64%).
| Demographics | Rating | Rank | Births to Unmarried Women |
| Scotch-Irish | 10.7 /100 | #210 | Poor 33.3% |
| Ecuadorians | 10.5 /100 | #211 | Poor 33.3% |
| Celtics | 10.2 /100 | #212 | Poor 33.3% |
| Immigrants | Costa Rica | 9.5 /100 | #213 | Tragic 33.4% |
| Slovaks | 9.3 /100 | #214 | Tragic 33.4% |
| French | 8.7 /100 | #215 | Tragic 33.4% |
| Nepalese | 7.8 /100 | #216 | Tragic 33.5% |
| Spaniards | 7.0 /100 | #217 | Tragic 33.6% |
| Immigrants | Ecuador | 5.9 /100 | #218 | Tragic 33.7% |
| Alsatians | 5.4 /100 | #219 | Tragic 33.8% |
| Portuguese | 5.4 /100 | #220 | Tragic 33.8% |
| Malaysians | 5.0 /100 | #221 | Tragic 33.9% |
| Immigrants | Uruguay | 4.8 /100 | #222 | Tragic 33.9% |
| Pennsylvania Germans | 4.3 /100 | #223 | Tragic 34.0% |
| Immigrants | Laos | 4.3 /100 | #224 | Tragic 34.0% |
Demographics Similar to Immigrants from Cambodia by Births to Unmarried Women
In terms of births to unmarried women, the demographic groups most similar to Immigrants from Cambodia are Marshallese (34.8%, a difference of 0.060%), Immigrants from Cameroon (34.7%, a difference of 0.13%), Sierra Leonean (34.9%, a difference of 0.22%), Immigrants from Middle Africa (34.9%, a difference of 0.47%), and Immigrants from Guyana (35.0%, a difference of 0.51%).
| Demographics | Rating | Rank | Births to Unmarried Women |
| Native Hawaiians | 2.9 /100 | #231 | Tragic 34.3% |
| French Canadians | 2.5 /100 | #232 | Tragic 34.4% |
| Bangladeshis | 2.5 /100 | #233 | Tragic 34.4% |
| Immigrants | Zaire | 2.3 /100 | #234 | Tragic 34.5% |
| Immigrants | Ghana | 2.2 /100 | #235 | Tragic 34.5% |
| Immigrants | Cameroon | 1.6 /100 | #236 | Tragic 34.7% |
| Marshallese | 1.6 /100 | #237 | Tragic 34.8% |
| Immigrants | Cambodia | 1.6 /100 | #238 | Tragic 34.8% |
| Sierra Leoneans | 1.4 /100 | #239 | Tragic 34.9% |
| Immigrants | Middle Africa | 1.2 /100 | #240 | Tragic 34.9% |
| Immigrants | Guyana | 1.2 /100 | #241 | Tragic 35.0% |
| Indonesians | 1.2 /100 | #242 | Tragic 35.0% |
| Japanese | 0.9 /100 | #243 | Tragic 35.2% |
| Guyanese | 0.9 /100 | #244 | Tragic 35.2% |
| Shoshone | 0.8 /100 | #245 | Tragic 35.3% |