Spaniard vs Immigrants from Eastern Asia Nursery School
COMPARE
Spaniard
Immigrants from Eastern Asia
Nursery School
Nursery School Comparison
Spaniards
Immigrants from Eastern Asia
98.2%
NURSERY SCHOOL
91.1/ 100
METRIC RATING
131st/ 347
METRIC RANK
97.7%
NURSERY SCHOOL
1.6/ 100
METRIC RATING
239th/ 347
METRIC RANK
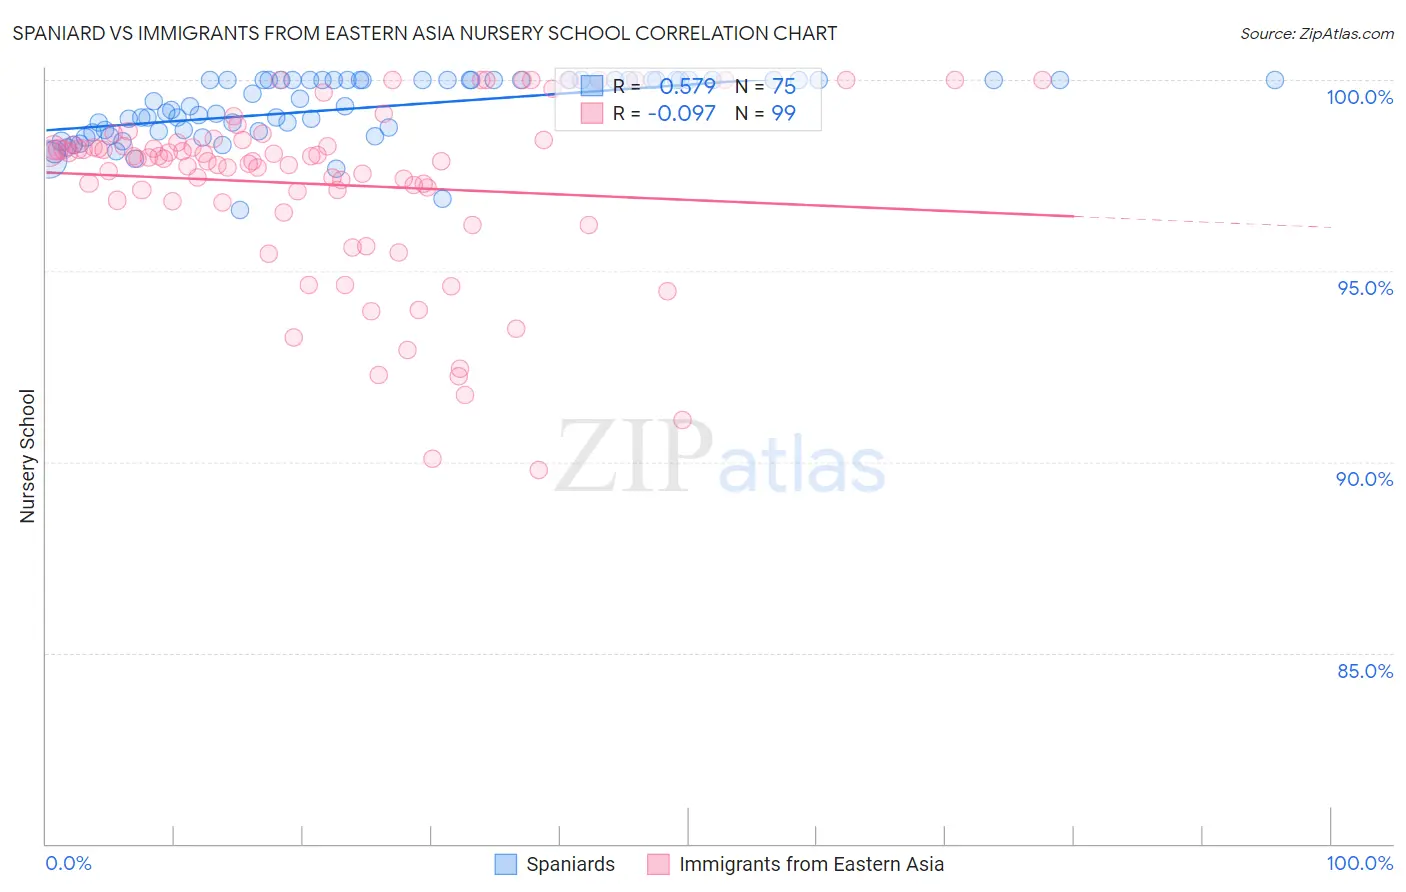
Spaniard vs Immigrants from Eastern Asia Nursery School Correlation Chart
The statistical analysis conducted on geographies consisting of 443,544,503 people shows a substantial positive correlation between the proportion of Spaniards and percentage of population with at least nursery school education in the United States with a correlation coefficient (R) of 0.579 and weighted average of 98.2%. Similarly, the statistical analysis conducted on geographies consisting of 499,865,893 people shows a slight negative correlation between the proportion of Immigrants from Eastern Asia and percentage of population with at least nursery school education in the United States with a correlation coefficient (R) of -0.097 and weighted average of 97.7%, a difference of 0.49%.
Nursery School Correlation Summary
| Measurement | Spaniard | Immigrants from Eastern Asia |
| Minimum | 96.6% | 89.8% |
| Maximum | 100.0% | 100.0% |
| Range | 3.4% | 10.2% |
| Mean | 99.3% | 97.3% |
| Median | 99.3% | 98.0% |
| Interquartile 25% (IQ1) | 98.7% | 96.8% |
| Interquartile 75% (IQ3) | 100.0% | 98.4% |
| Interquartile Range (IQR) | 1.3% | 1.5% |
| Standard Deviation (Sample) | 0.83% | 2.3% |
| Standard Deviation (Population) | 0.82% | 2.3% |
Similar Demographics by Nursery School
Demographics Similar to Spaniards by Nursery School
In terms of nursery school, the demographic groups most similar to Spaniards are Cambodian (98.2%, a difference of 0.0%), Immigrants from Croatia (98.2%, a difference of 0.0%), Seminole (98.2%, a difference of 0.0%), Immigrants from Europe (98.1%, a difference of 0.0%), and Immigrants from Serbia (98.2%, a difference of 0.010%).
| Demographics | Rating | Rank | Nursery School |
| Lebanese | 93.8 /100 | #124 | Exceptional 98.2% |
| Iroquois | 93.7 /100 | #125 | Exceptional 98.2% |
| Menominee | 93.6 /100 | #126 | Exceptional 98.2% |
| Immigrants | Saudi Arabia | 93.4 /100 | #127 | Exceptional 98.2% |
| Immigrants | Serbia | 92.4 /100 | #128 | Exceptional 98.2% |
| Cambodians | 91.4 /100 | #129 | Exceptional 98.2% |
| Immigrants | Croatia | 91.4 /100 | #130 | Exceptional 98.2% |
| Spaniards | 91.1 /100 | #131 | Exceptional 98.2% |
| Seminole | 90.9 /100 | #132 | Exceptional 98.2% |
| Immigrants | Europe | 90.7 /100 | #133 | Exceptional 98.1% |
| Immigrants | Bulgaria | 89.4 /100 | #134 | Excellent 98.1% |
| Immigrants | Hungary | 89.3 /100 | #135 | Excellent 98.1% |
| Immigrants | Kuwait | 88.9 /100 | #136 | Excellent 98.1% |
| Israelis | 88.2 /100 | #137 | Excellent 98.1% |
| Immigrants | Romania | 88.0 /100 | #138 | Excellent 98.1% |
Demographics Similar to Immigrants from Eastern Asia by Nursery School
In terms of nursery school, the demographic groups most similar to Immigrants from Eastern Asia are Nigerian (97.7%, a difference of 0.010%), Korean (97.7%, a difference of 0.010%), U.S. Virgin Islander (97.7%, a difference of 0.020%), Colombian (97.7%, a difference of 0.020%), and Immigrants from Pakistan (97.7%, a difference of 0.020%).
| Demographics | Rating | Rank | Nursery School |
| Immigrants | Uruguay | 2.3 /100 | #232 | Tragic 97.7% |
| U.S. Virgin Islanders | 2.1 /100 | #233 | Tragic 97.7% |
| Colombians | 2.1 /100 | #234 | Tragic 97.7% |
| Immigrants | Pakistan | 2.1 /100 | #235 | Tragic 97.7% |
| Immigrants | Malaysia | 1.9 /100 | #236 | Tragic 97.7% |
| Immigrants | Western Asia | 1.9 /100 | #237 | Tragic 97.7% |
| Nigerians | 1.7 /100 | #238 | Tragic 97.7% |
| Immigrants | Eastern Asia | 1.6 /100 | #239 | Tragic 97.7% |
| Koreans | 1.4 /100 | #240 | Tragic 97.7% |
| Immigrants | Indonesia | 1.1 /100 | #241 | Tragic 97.7% |
| Liberians | 1.1 /100 | #242 | Tragic 97.7% |
| Asians | 1.1 /100 | #243 | Tragic 97.6% |
| South Americans | 1.0 /100 | #244 | Tragic 97.6% |
| Bolivians | 1.0 /100 | #245 | Tragic 97.6% |
| Peruvians | 1.0 /100 | #246 | Tragic 97.6% |