Spaniard vs Immigrants from Cambodia Divorced or Separated
COMPARE
Spaniard
Immigrants from Cambodia
Divorced or Separated
Divorced or Separated Comparison
Spaniards
Immigrants from Cambodia
12.7%
DIVORCED OR SEPARATED
0.2/ 100
METRIC RATING
276th/ 347
METRIC RANK
11.8%
DIVORCED OR SEPARATED
88.2/ 100
METRIC RATING
131st/ 347
METRIC RANK
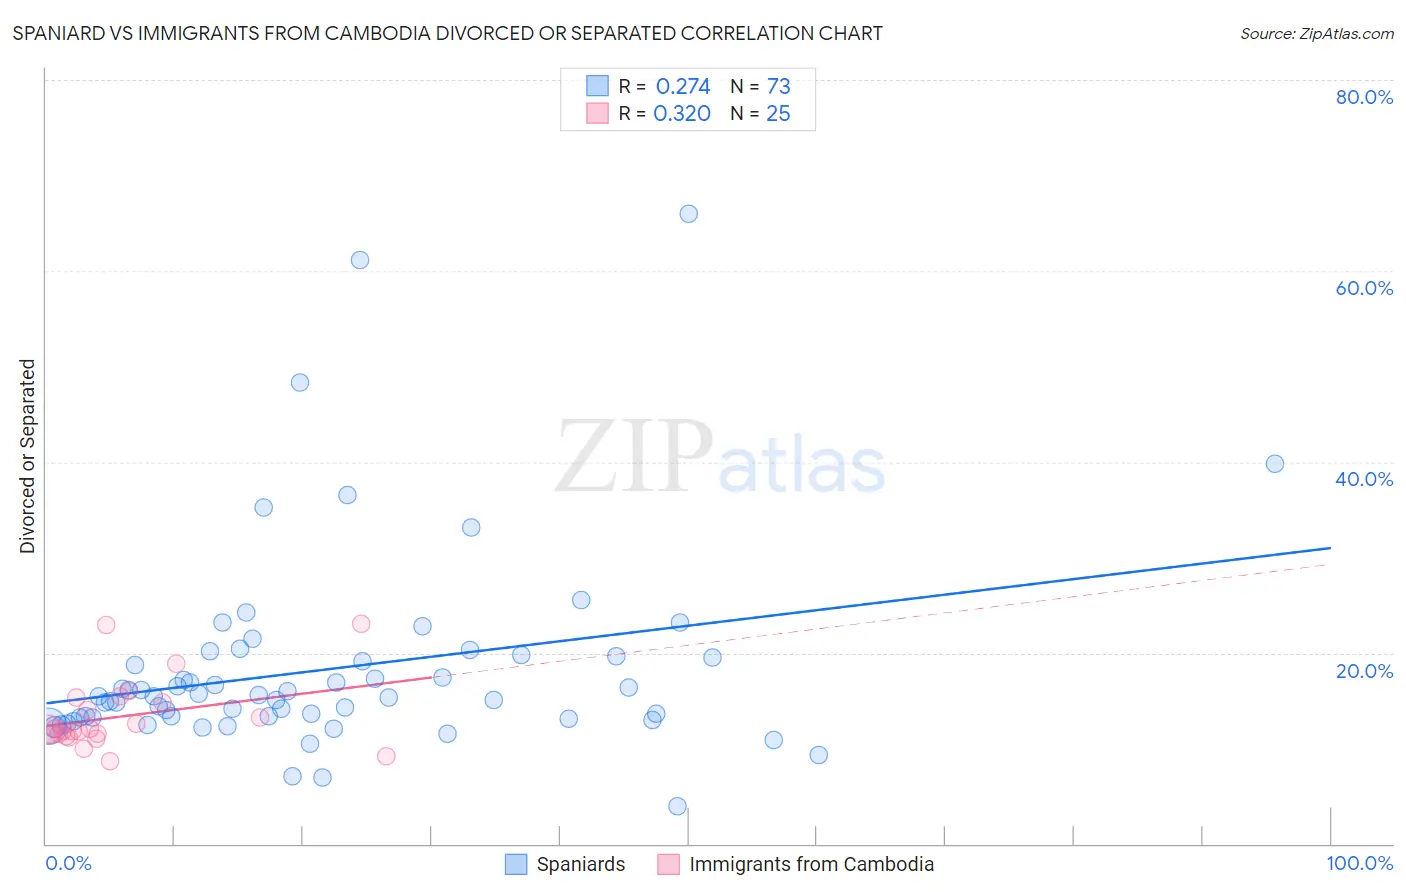
Spaniard vs Immigrants from Cambodia Divorced or Separated Correlation Chart
The statistical analysis conducted on geographies consisting of 443,302,888 people shows a weak positive correlation between the proportion of Spaniards and percentage of population currently divorced or separated in the United States with a correlation coefficient (R) of 0.274 and weighted average of 12.7%. Similarly, the statistical analysis conducted on geographies consisting of 205,150,019 people shows a mild positive correlation between the proportion of Immigrants from Cambodia and percentage of population currently divorced or separated in the United States with a correlation coefficient (R) of 0.320 and weighted average of 11.8%, a difference of 7.1%.
Divorced or Separated Correlation Summary
| Measurement | Spaniard | Immigrants from Cambodia |
| Minimum | 3.9% | 8.6% |
| Maximum | 66.0% | 23.0% |
| Range | 62.1% | 14.4% |
| Mean | 18.3% | 13.3% |
| Median | 15.4% | 12.0% |
| Interquartile 25% (IQ1) | 13.2% | 11.3% |
| Interquartile 75% (IQ3) | 19.5% | 15.1% |
| Interquartile Range (IQR) | 6.3% | 3.7% |
| Standard Deviation (Sample) | 10.5% | 3.7% |
| Standard Deviation (Population) | 10.4% | 3.6% |
Similar Demographics by Divorced or Separated
Demographics Similar to Spaniards by Divorced or Separated
In terms of divorced or separated, the demographic groups most similar to Spaniards are Dominican (12.7%, a difference of 0.050%), Central American Indian (12.7%, a difference of 0.060%), Bermudan (12.7%, a difference of 0.090%), Immigrants from Micronesia (12.7%, a difference of 0.10%), and Lumbee (12.7%, a difference of 0.21%).
| Demographics | Rating | Rank | Divorced or Separated |
| Immigrants | Liberia | 0.4 /100 | #269 | Tragic 12.6% |
| Ute | 0.4 /100 | #270 | Tragic 12.6% |
| Panamanians | 0.3 /100 | #271 | Tragic 12.7% |
| Immigrants | Middle Africa | 0.3 /100 | #272 | Tragic 12.7% |
| Immigrants | Micronesia | 0.3 /100 | #273 | Tragic 12.7% |
| Bermudans | 0.3 /100 | #274 | Tragic 12.7% |
| Central American Indians | 0.3 /100 | #275 | Tragic 12.7% |
| Spaniards | 0.2 /100 | #276 | Tragic 12.7% |
| Dominicans | 0.2 /100 | #277 | Tragic 12.7% |
| Lumbee | 0.2 /100 | #278 | Tragic 12.7% |
| Immigrants | Dominican Republic | 0.2 /100 | #279 | Tragic 12.7% |
| Immigrants | Zaire | 0.2 /100 | #280 | Tragic 12.7% |
| Pueblo | 0.2 /100 | #281 | Tragic 12.7% |
| Sub-Saharan Africans | 0.1 /100 | #282 | Tragic 12.7% |
| Delaware | 0.1 /100 | #283 | Tragic 12.7% |
Demographics Similar to Immigrants from Cambodia by Divorced or Separated
In terms of divorced or separated, the demographic groups most similar to Immigrants from Cambodia are Immigrants from Austria (11.8%, a difference of 0.0%), Immigrants from St. Vincent and the Grenadines (11.8%, a difference of 0.020%), Immigrants from Afghanistan (11.8%, a difference of 0.030%), South African (11.8%, a difference of 0.060%), and Immigrants from Ecuador (11.8%, a difference of 0.060%).
| Demographics | Rating | Rank | Divorced or Separated |
| Ugandans | 93.1 /100 | #124 | Exceptional 11.8% |
| Ukrainians | 92.3 /100 | #125 | Exceptional 11.8% |
| South American Indians | 92.1 /100 | #126 | Exceptional 11.8% |
| South Africans | 88.9 /100 | #127 | Excellent 11.8% |
| Immigrants | Ecuador | 88.9 /100 | #128 | Excellent 11.8% |
| Immigrants | St. Vincent and the Grenadines | 88.4 /100 | #129 | Excellent 11.8% |
| Immigrants | Austria | 88.2 /100 | #130 | Excellent 11.8% |
| Immigrants | Cambodia | 88.2 /100 | #131 | Excellent 11.8% |
| Immigrants | Afghanistan | 87.9 /100 | #132 | Excellent 11.8% |
| New Zealanders | 87.5 /100 | #133 | Excellent 11.9% |
| Argentineans | 85.1 /100 | #134 | Excellent 11.9% |
| Danes | 84.8 /100 | #135 | Excellent 11.9% |
| Carpatho Rusyns | 84.8 /100 | #136 | Excellent 11.9% |
| Alsatians | 84.0 /100 | #137 | Excellent 11.9% |
| Immigrants | Netherlands | 83.9 /100 | #138 | Excellent 11.9% |