Argentinean vs Immigrants from Cambodia Nursery School
COMPARE
Argentinean
Immigrants from Cambodia
Nursery School
Nursery School Comparison
Argentineans
Immigrants from Cambodia
98.0%
NURSERY SCHOOL
46.8/ 100
METRIC RATING
179th/ 347
METRIC RANK
96.5%
NURSERY SCHOOL
0.0/ 100
METRIC RATING
337th/ 347
METRIC RANK
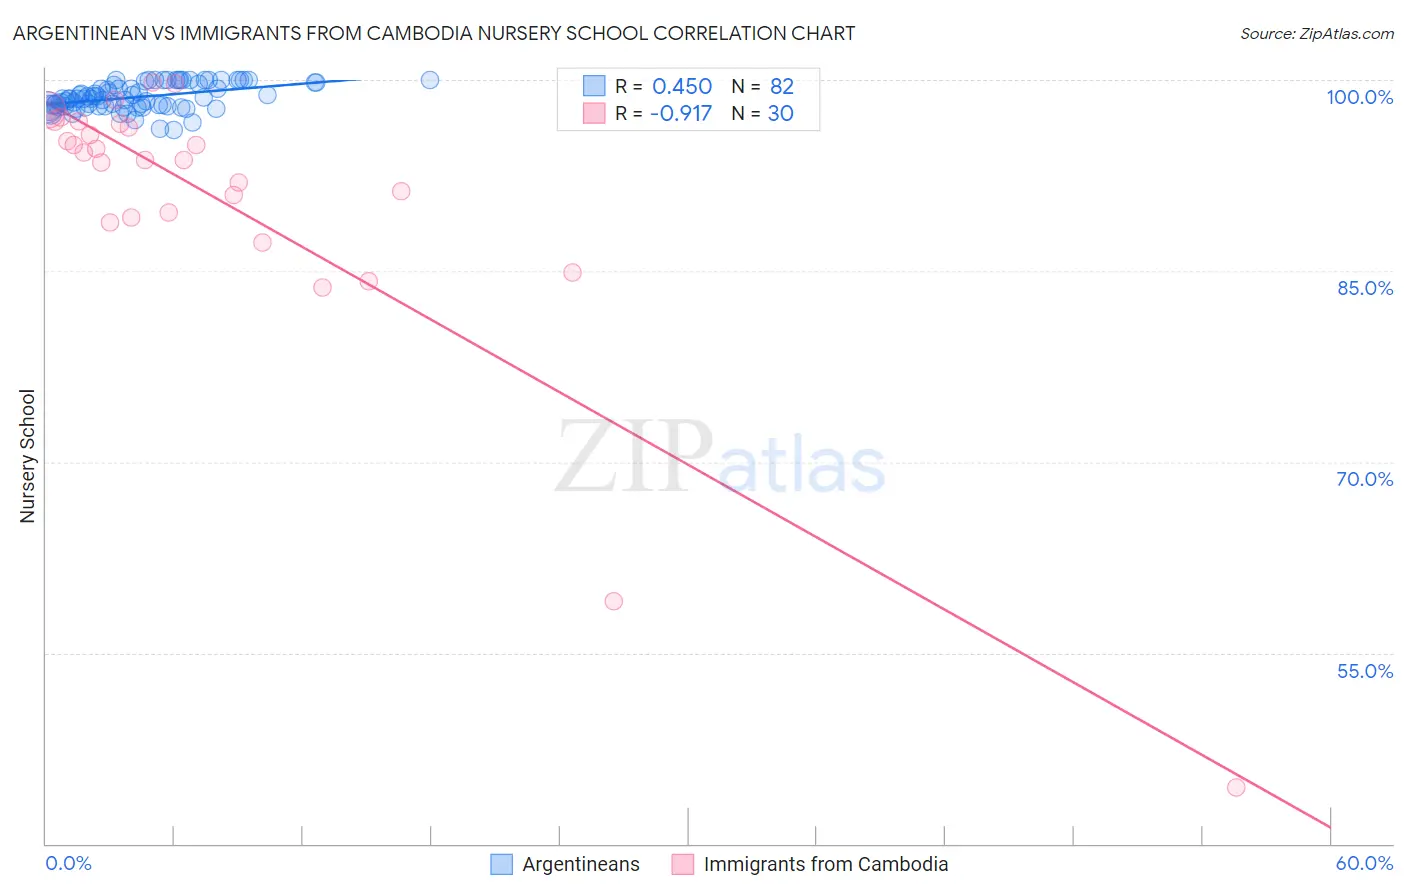
Argentinean vs Immigrants from Cambodia Nursery School Correlation Chart
The statistical analysis conducted on geographies consisting of 297,146,811 people shows a moderate positive correlation between the proportion of Argentineans and percentage of population with at least nursery school education in the United States with a correlation coefficient (R) of 0.450 and weighted average of 98.0%. Similarly, the statistical analysis conducted on geographies consisting of 205,153,442 people shows a near-perfect negative correlation between the proportion of Immigrants from Cambodia and percentage of population with at least nursery school education in the United States with a correlation coefficient (R) of -0.917 and weighted average of 96.5%, a difference of 1.5%.
Nursery School Correlation Summary
| Measurement | Argentinean | Immigrants from Cambodia |
| Minimum | 96.1% | 44.4% |
| Maximum | 100.0% | 99.8% |
| Range | 3.9% | 55.4% |
| Mean | 98.7% | 90.5% |
| Median | 98.5% | 94.0% |
| Interquartile 25% (IQ1) | 98.0% | 89.2% |
| Interquartile 75% (IQ3) | 99.8% | 96.6% |
| Interquartile Range (IQR) | 1.8% | 7.4% |
| Standard Deviation (Sample) | 1.00% | 11.6% |
| Standard Deviation (Population) | 0.99% | 11.4% |
Similar Demographics by Nursery School
Demographics Similar to Argentineans by Nursery School
In terms of nursery school, the demographic groups most similar to Argentineans are Immigrants from Bosnia and Herzegovina (98.0%, a difference of 0.0%), Immigrants from Brazil (98.0%, a difference of 0.010%), Kenyan (98.0%, a difference of 0.010%), Navajo (98.0%, a difference of 0.010%), and Immigrants from Sri Lanka (98.0%, a difference of 0.010%).
| Demographics | Rating | Rank | Nursery School |
| Immigrants | Brazil | 51.3 /100 | #172 | Average 98.0% |
| Kenyans | 50.2 /100 | #173 | Average 98.0% |
| Navajo | 50.0 /100 | #174 | Average 98.0% |
| Immigrants | Sri Lanka | 49.9 /100 | #175 | Average 98.0% |
| Immigrants | Venezuela | 49.8 /100 | #176 | Average 98.0% |
| Albanians | 48.9 /100 | #177 | Average 98.0% |
| Natives/Alaskans | 48.6 /100 | #178 | Average 98.0% |
| Argentineans | 46.8 /100 | #179 | Average 98.0% |
| Immigrants | Bosnia and Herzegovina | 45.6 /100 | #180 | Average 98.0% |
| Egyptians | 42.8 /100 | #181 | Average 98.0% |
| Paiute | 42.0 /100 | #182 | Average 98.0% |
| Portuguese | 41.8 /100 | #183 | Average 98.0% |
| Immigrants | Poland | 41.3 /100 | #184 | Average 98.0% |
| Immigrants | Belarus | 41.0 /100 | #185 | Average 98.0% |
| Immigrants | Argentina | 40.8 /100 | #186 | Average 98.0% |
Demographics Similar to Immigrants from Cambodia by Nursery School
In terms of nursery school, the demographic groups most similar to Immigrants from Cambodia are Immigrants from Fiji (96.5%, a difference of 0.0%), Guatemalan (96.6%, a difference of 0.040%), Bangladeshi (96.6%, a difference of 0.070%), Immigrants from Guatemala (96.4%, a difference of 0.080%), and Immigrants from Dominican Republic (96.6%, a difference of 0.090%).
| Demographics | Rating | Rank | Nursery School |
| Japanese | 0.0 /100 | #330 | Tragic 96.7% |
| Immigrants | Armenia | 0.0 /100 | #331 | Tragic 96.7% |
| Yakama | 0.0 /100 | #332 | Tragic 96.6% |
| Central Americans | 0.0 /100 | #333 | Tragic 96.6% |
| Immigrants | Dominican Republic | 0.0 /100 | #334 | Tragic 96.6% |
| Bangladeshis | 0.0 /100 | #335 | Tragic 96.6% |
| Guatemalans | 0.0 /100 | #336 | Tragic 96.6% |
| Immigrants | Cambodia | 0.0 /100 | #337 | Tragic 96.5% |
| Immigrants | Fiji | 0.0 /100 | #338 | Tragic 96.5% |
| Immigrants | Guatemala | 0.0 /100 | #339 | Tragic 96.4% |
| Immigrants | Central America | 0.0 /100 | #340 | Tragic 96.4% |
| Immigrants | Cabo Verde | 0.0 /100 | #341 | Tragic 96.4% |
| Immigrants | Mexico | 0.0 /100 | #342 | Tragic 96.4% |
| Salvadorans | 0.0 /100 | #343 | Tragic 96.4% |
| Immigrants | El Salvador | 0.0 /100 | #344 | Tragic 96.2% |