Spaniard vs Immigrants from Cambodia 4th Grade
COMPARE
Spaniard
Immigrants from Cambodia
4th Grade
4th Grade Comparison
Spaniards
Immigrants from Cambodia
97.7%
4TH GRADE
82.7/ 100
METRIC RATING
144th/ 347
METRIC RANK
95.8%
4TH GRADE
0.0/ 100
METRIC RATING
329th/ 347
METRIC RANK
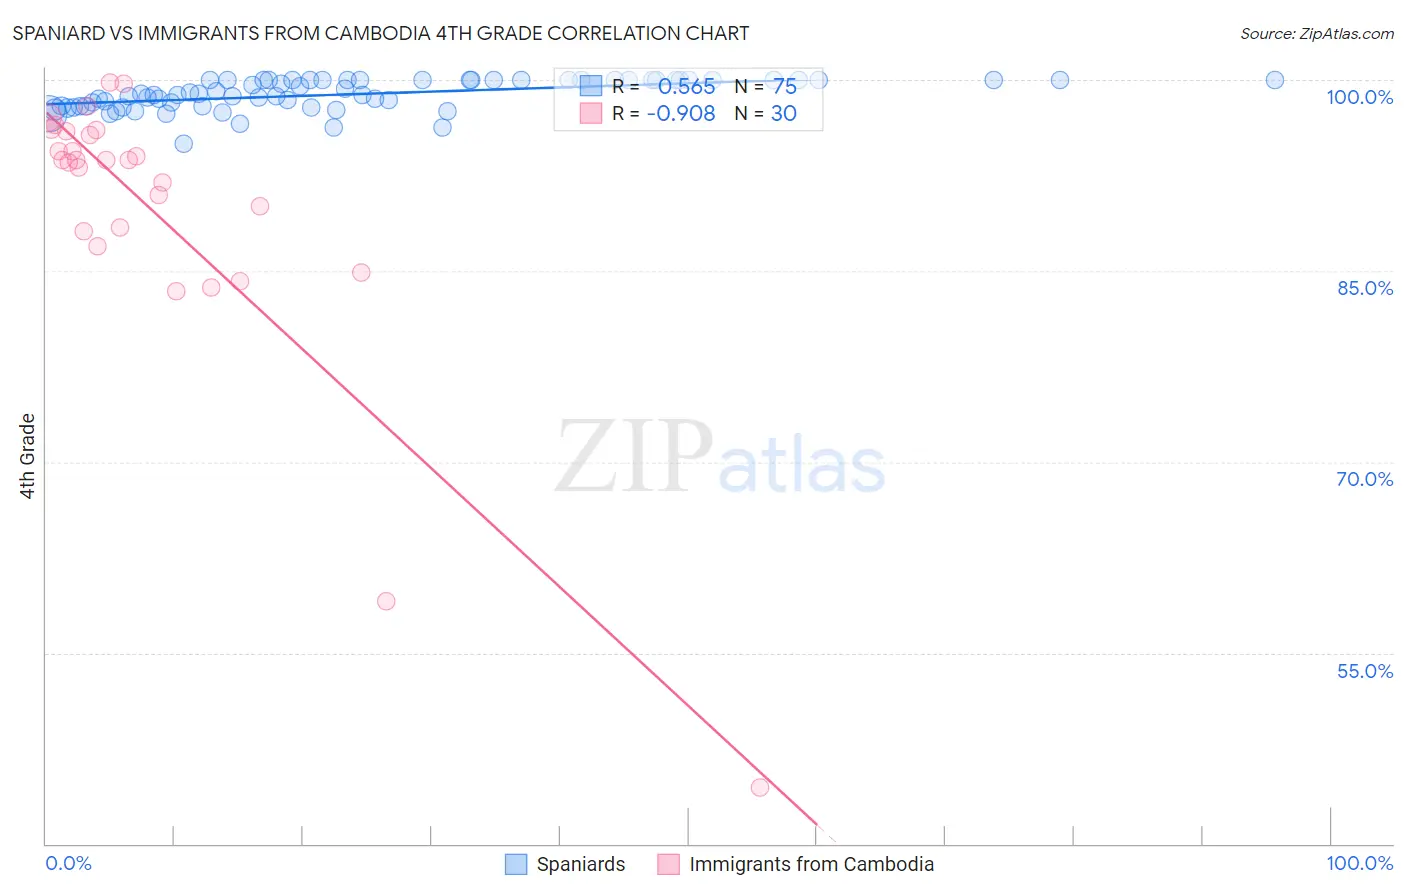
Spaniard vs Immigrants from Cambodia 4th Grade Correlation Chart
The statistical analysis conducted on geographies consisting of 443,544,503 people shows a substantial positive correlation between the proportion of Spaniards and percentage of population with at least 4th grade education in the United States with a correlation coefficient (R) of 0.565 and weighted average of 97.7%. Similarly, the statistical analysis conducted on geographies consisting of 205,153,442 people shows a near-perfect negative correlation between the proportion of Immigrants from Cambodia and percentage of population with at least 4th grade education in the United States with a correlation coefficient (R) of -0.908 and weighted average of 95.8%, a difference of 1.9%.
4th Grade Correlation Summary
| Measurement | Spaniard | Immigrants from Cambodia |
| Minimum | 94.9% | 44.4% |
| Maximum | 100.0% | 99.8% |
| Range | 5.1% | 55.4% |
| Mean | 98.9% | 89.8% |
| Median | 98.9% | 93.7% |
| Interquartile 25% (IQ1) | 97.9% | 88.2% |
| Interquartile 75% (IQ3) | 100.0% | 96.0% |
| Interquartile Range (IQR) | 2.1% | 7.8% |
| Standard Deviation (Sample) | 1.2% | 11.5% |
| Standard Deviation (Population) | 1.2% | 11.3% |
Similar Demographics by 4th Grade
Demographics Similar to Spaniards by 4th Grade
In terms of 4th grade, the demographic groups most similar to Spaniards are Immigrants from North Macedonia (97.7%, a difference of 0.0%), Burmese (97.7%, a difference of 0.0%), Immigrants from Moldova (97.7%, a difference of 0.0%), Seminole (97.7%, a difference of 0.010%), and Filipino (97.7%, a difference of 0.010%).
| Demographics | Rating | Rank | 4th Grade |
| Immigrants | Turkey | 86.0 /100 | #137 | Excellent 97.7% |
| Blackfeet | 86.0 /100 | #138 | Excellent 97.7% |
| Seminole | 84.7 /100 | #139 | Excellent 97.7% |
| Filipinos | 84.0 /100 | #140 | Excellent 97.7% |
| Immigrants | Greece | 83.8 /100 | #141 | Excellent 97.7% |
| Immigrants | North Macedonia | 83.3 /100 | #142 | Excellent 97.7% |
| Burmese | 82.8 /100 | #143 | Excellent 97.7% |
| Spaniards | 82.7 /100 | #144 | Excellent 97.7% |
| Immigrants | Moldova | 82.4 /100 | #145 | Excellent 97.7% |
| Jordanians | 81.3 /100 | #146 | Excellent 97.7% |
| Ute | 80.6 /100 | #147 | Excellent 97.7% |
| Hopi | 80.6 /100 | #148 | Excellent 97.7% |
| Soviet Union | 77.8 /100 | #149 | Good 97.6% |
| Immigrants | Israel | 77.7 /100 | #150 | Good 97.6% |
| Alsatians | 77.2 /100 | #151 | Good 97.6% |
Demographics Similar to Immigrants from Cambodia by 4th Grade
In terms of 4th grade, the demographic groups most similar to Immigrants from Cambodia are Immigrants from Fiji (95.8%, a difference of 0.0%), Mexican American Indian (95.8%, a difference of 0.010%), Immigrants from Armenia (95.8%, a difference of 0.050%), Immigrants from Honduras (95.8%, a difference of 0.060%), and Immigrants from Dominican Republic (95.7%, a difference of 0.11%).
| Demographics | Rating | Rank | 4th Grade |
| Immigrants | Vietnam | 0.0 /100 | #322 | Tragic 96.0% |
| Immigrants | Nicaragua | 0.0 /100 | #323 | Tragic 96.0% |
| Immigrants | Belize | 0.0 /100 | #324 | Tragic 96.0% |
| Dominicans | 0.0 /100 | #325 | Tragic 96.0% |
| Hispanics or Latinos | 0.0 /100 | #326 | Tragic 96.0% |
| Hondurans | 0.0 /100 | #327 | Tragic 96.0% |
| Mexican American Indians | 0.0 /100 | #328 | Tragic 95.8% |
| Immigrants | Cambodia | 0.0 /100 | #329 | Tragic 95.8% |
| Immigrants | Fiji | 0.0 /100 | #330 | Tragic 95.8% |
| Immigrants | Armenia | 0.0 /100 | #331 | Tragic 95.8% |
| Immigrants | Honduras | 0.0 /100 | #332 | Tragic 95.8% |
| Immigrants | Dominican Republic | 0.0 /100 | #333 | Tragic 95.7% |
| Immigrants | Cabo Verde | 0.0 /100 | #334 | Tragic 95.7% |
| Immigrants | Latin America | 0.0 /100 | #335 | Tragic 95.7% |
| Mexicans | 0.0 /100 | #336 | Tragic 95.6% |