Spaniard vs Immigrants from Cambodia Disability Age 65 to 74
COMPARE
Spaniard
Immigrants from Cambodia
Disability Age 65 to 74
Disability Age 65 to 74 Comparison
Spaniards
Immigrants from Cambodia
24.6%
DISABILITY AGE 65 TO 74
2.4/ 100
METRIC RATING
240th/ 347
METRIC RANK
25.3%
DISABILITY AGE 65 TO 74
0.3/ 100
METRIC RATING
259th/ 347
METRIC RANK
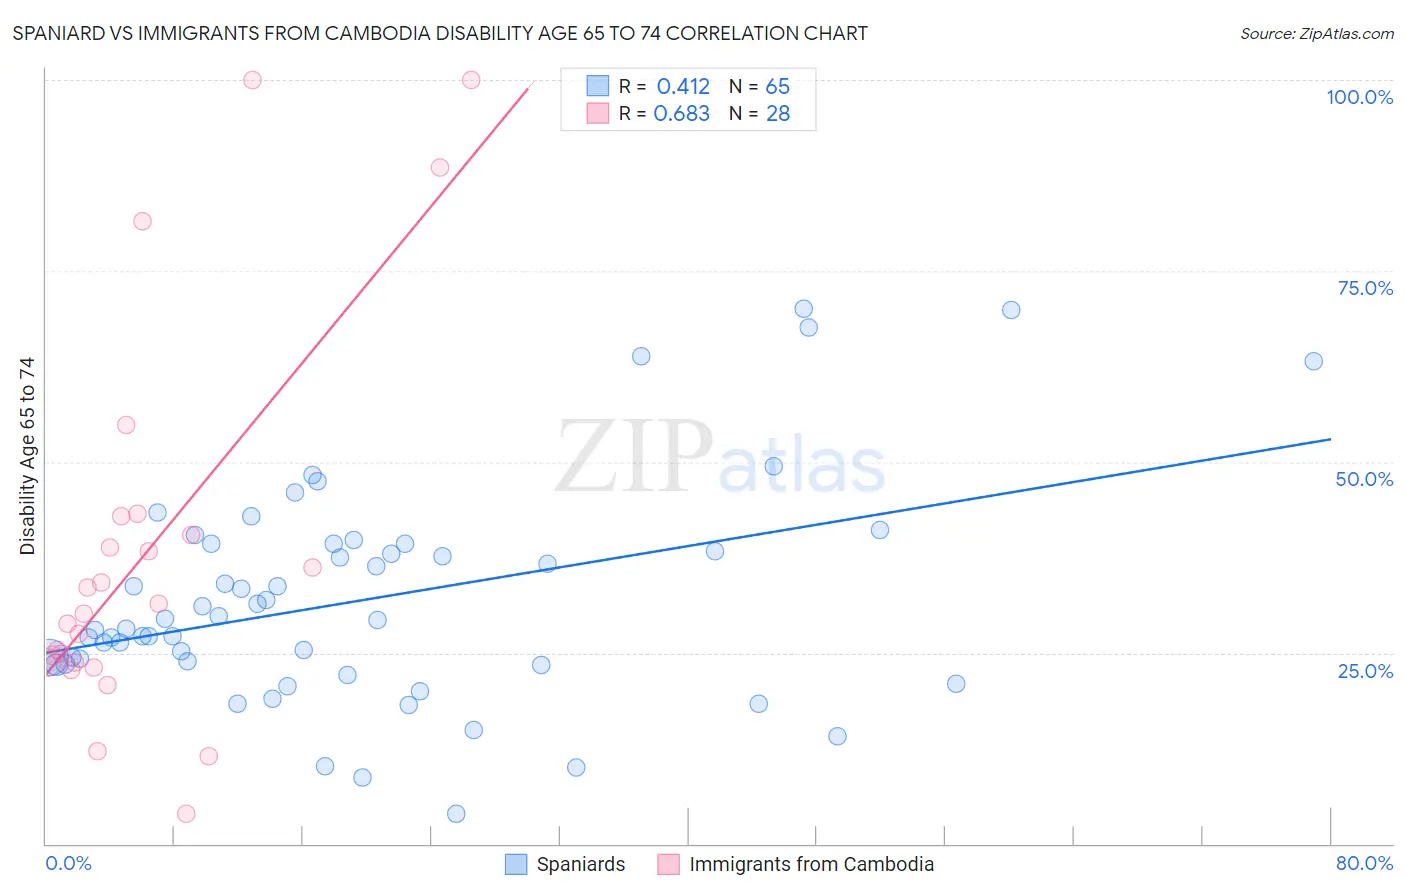
Spaniard vs Immigrants from Cambodia Disability Age 65 to 74 Correlation Chart
The statistical analysis conducted on geographies consisting of 442,368,697 people shows a moderate positive correlation between the proportion of Spaniards and percentage of population with a disability between the ages 65 and 75 in the United States with a correlation coefficient (R) of 0.412 and weighted average of 24.6%. Similarly, the statistical analysis conducted on geographies consisting of 205,056,933 people shows a significant positive correlation between the proportion of Immigrants from Cambodia and percentage of population with a disability between the ages 65 and 75 in the United States with a correlation coefficient (R) of 0.683 and weighted average of 25.3%, a difference of 3.0%.
Disability Age 65 to 74 Correlation Summary
| Measurement | Spaniard | Immigrants from Cambodia |
| Minimum | 4.0% | 4.0% |
| Maximum | 70.1% | 100.0% |
| Range | 66.1% | 96.0% |
| Mean | 31.9% | 38.1% |
| Median | 29.3% | 30.8% |
| Interquartile 25% (IQ1) | 23.5% | 23.8% |
| Interquartile 75% (IQ3) | 39.3% | 41.6% |
| Interquartile Range (IQR) | 15.8% | 17.9% |
| Standard Deviation (Sample) | 14.2% | 25.1% |
| Standard Deviation (Population) | 14.1% | 24.6% |
Demographics Similar to Spaniards and Immigrants from Cambodia by Disability Age 65 to 74
In terms of disability age 65 to 74, the demographic groups most similar to Spaniards are Immigrants from Western Africa (24.6%, a difference of 0.080%), Immigrants from Caribbean (24.6%, a difference of 0.090%), Immigrants from Senegal (24.6%, a difference of 0.16%), Spanish (24.6%, a difference of 0.18%), and Armenian (24.7%, a difference of 0.30%). Similarly, the demographic groups most similar to Immigrants from Cambodia are Marshallese (25.3%, a difference of 0.090%), Guamanian/Chamorro (25.3%, a difference of 0.15%), Immigrants from Somalia (25.2%, a difference of 0.32%), Central American (25.1%, a difference of 0.74%), and Somali (25.1%, a difference of 0.90%).
| Demographics | Rating | Rank | Disability Age 65 to 74 |
| Immigrants | Caribbean | 2.6 /100 | #239 | Tragic 24.6% |
| Spaniards | 2.4 /100 | #240 | Tragic 24.6% |
| Immigrants | Western Africa | 2.3 /100 | #241 | Tragic 24.6% |
| Immigrants | Senegal | 2.2 /100 | #242 | Tragic 24.6% |
| Spanish | 2.2 /100 | #243 | Tragic 24.6% |
| Armenians | 2.0 /100 | #244 | Tragic 24.7% |
| British West Indians | 2.0 /100 | #245 | Tragic 24.7% |
| Immigrants | Iraq | 1.9 /100 | #246 | Tragic 24.7% |
| Indonesians | 1.1 /100 | #247 | Tragic 24.9% |
| Senegalese | 0.9 /100 | #248 | Tragic 24.9% |
| Immigrants | Fiji | 0.8 /100 | #249 | Tragic 25.0% |
| Salvadorans | 0.8 /100 | #250 | Tragic 25.0% |
| Immigrants | Nonimmigrants | 0.7 /100 | #251 | Tragic 25.0% |
| Immigrants | El Salvador | 0.6 /100 | #252 | Tragic 25.1% |
| Sub-Saharan Africans | 0.6 /100 | #253 | Tragic 25.1% |
| Somalis | 0.6 /100 | #254 | Tragic 25.1% |
| Central Americans | 0.5 /100 | #255 | Tragic 25.1% |
| Immigrants | Somalia | 0.4 /100 | #256 | Tragic 25.2% |
| Guamanians/Chamorros | 0.3 /100 | #257 | Tragic 25.3% |
| Marshallese | 0.3 /100 | #258 | Tragic 25.3% |
| Immigrants | Cambodia | 0.3 /100 | #259 | Tragic 25.3% |